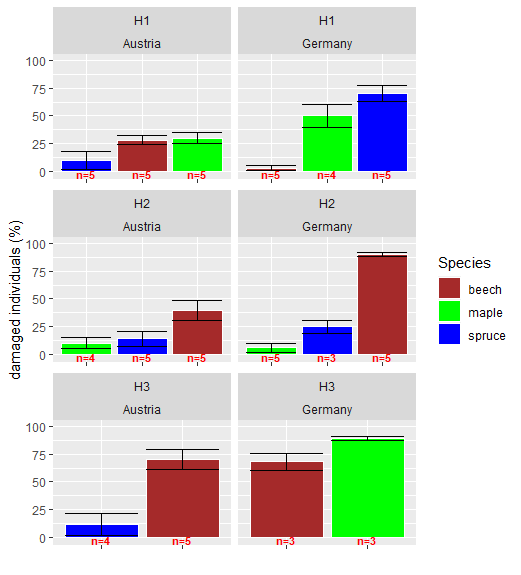
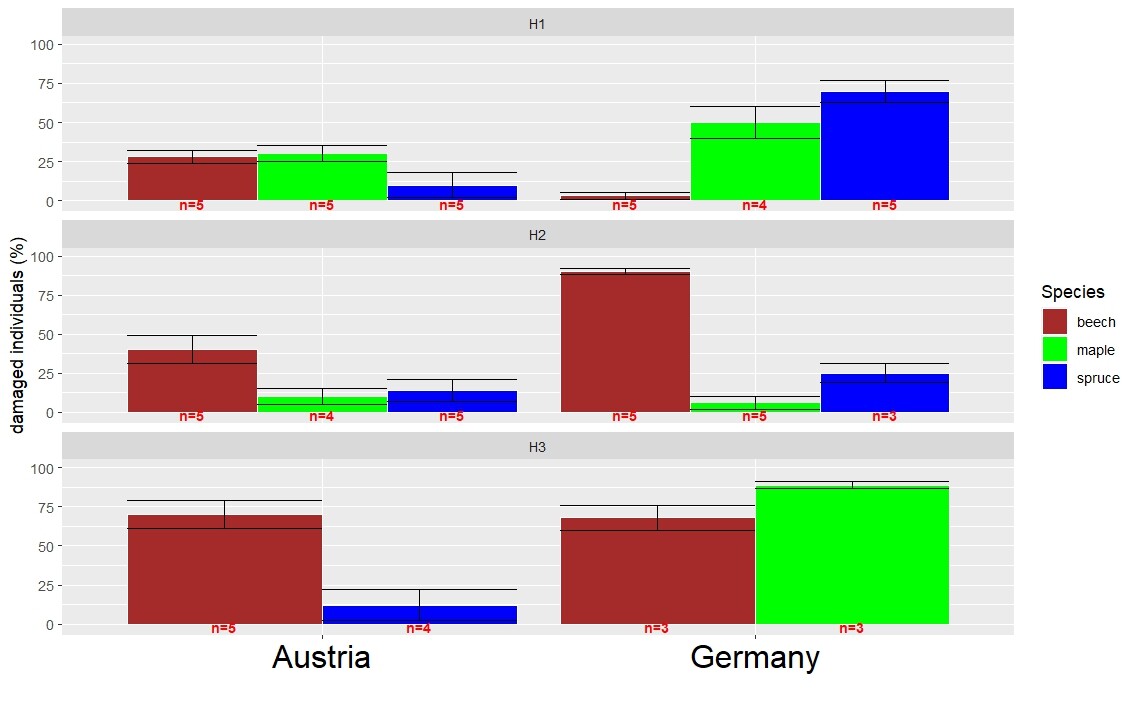
Hello, I've tried to create a grouped barplot with ggplot. I was quite sucessfull, but there's an issue, I'm unable to fix: I don't want to have the catagorial variable in the fill-argument shown in a specific order, but in order from highest to lowest value (mean). In my case: I have the percentage of damaged trees within different species height classes and countries. I want to show the mean and order the bars from highest to lowest value, so it's easier to see, which species was damaged mostly per heightclass/country. For this, I used the contry for x-argument, species for fill-argument and seperate the height classes by facet_wrap (I want to have species in fill argument for a few reasons, firstly for making them well comparable, but mostly because my real dataset contains more than 3 species and I'd like to have them listed in a legend rather on the axes).
I've attached the code below. Does anybody have an idea?
library(ggplot2)

#creating suitable data
data <- data.frame(species = factor(c("beech","maple","spruce","beech","maple","spruce","beech","maple","spruce","beech","maple","spruce","beech","spruce","beech","maple")),
                   Heightclass = factor(c("H1","H1","H1","H1","H1","H1","H2","H2","H2","H2","H2","H2","H3","H3","H3","H3")),
                   country=factor(c("Austria", "Austria","Austria","Germany","Germany","Germany","Austria","Austria","Austria","Germany","Germany","Germany","Austria","Austria","Germany","Germany")),
                   mean=c(28,30,10,3,50,70,40,10,14,90,6,25,70,12,68,89),
                   se=c(4,5,8,2,10,7,9,5,7,2,4,6,9,10,8,2),
                   ntext=c("n=5","n=5","n=5","n=5","n=4","n=5","n=5","n=4","n=5","n=5","n=5","n=3","n=5","n=4","n=3","n=3"))
data

#Attemting plotting
data%>%
  ggplot(aes(x = country, y = mean,fill=species)) +
  geom_bar(stat="identity",position="dodge",colour="white")+
  geom_errorbar( aes(x=country, ymin=mean-se, ymax=mean+se),colour="black",  position=position_dodge(.9))+
  labs(x = "", y = "damaged individuals (%)") +
  scale_fill_manual("Species", values = c("beech"="brown","maple"="green","spruce"="blue"))+
  geom_text(aes(label = ntext,y=-2),position=position_dodge(.9),colour="red",fontface="bold",size=3) +
  ylim(-2,100)+
  facet_wrap(~Heightclass,nrow = 3)+
  theme(axis.text.x = element_text(color = "black", size = 20))
´´´