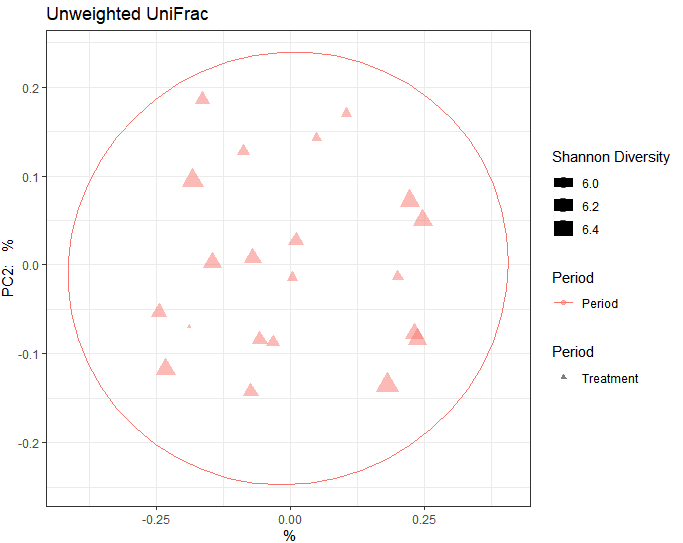
I made the pcoa plot through qiime2R, but the representation seem to all be same colors and my ellipsoid is just one surrounding the entire data. here is my code. please what should i fix here?
library(qiime2R)
library(tidyverse)
metadata55<-readr::read_tsv("D:/Qiime222/New_metadata55.tsv")
#> Rows: 21 Columns: 11
#> -- Column specification --------------------------------------------------------
#> Delimiter: "\t"
#> chr (3): SampleID, Treatment, Period
#> dbl (8): pH, Alkalinity_g CaCO3/kg, TAN(g N/kg), TVFAs_g/kg, TS, VS, daily_m...
#>
#> i Use `spec()` to retrieve the full column specification for this data.
#> i Specify the column types or set `show_col_types = FALSE` to quiet this message.
uwunifrac<-read_qza("D:/Qiime222/unweighted_unifrac_pcoa_results.qza")
shannon<-read_qza("D:/Qiime222/shannon_vector.qza")$data %>% rownames_to_column("SampleID")
uwunifrac$data$Vectors %>%
  + left_join(metadata55) %>%
  + left_join(shannon) %>%
  + ggplot(aes(x=PC1, y=PC2, color= 'Period > 4', shape = 'Treatment', size= shannon_entropy)) + geom_point(alpha=0.5)+ xlab(paste(round(100*uwunifrac$data$vectors[1],2),"%")) + ylab(paste("PC2: ", round(100*uwunifrac$data$vectors[2]), "%")) + theme_bw() + scale_shape_manual(values=c(17,1), name="Period") + scale_size_continuous(name="Shannon Diversity") + scale_color_discrete(name="Period") + ggtitle("Unweighted UniFrac") + stat_ellipse()
#> Error in auto_copy(x, y, copy = copy): argument "y" is missing, with no default
Created on 2021-11-22 by the reprex package (v2.0.1)