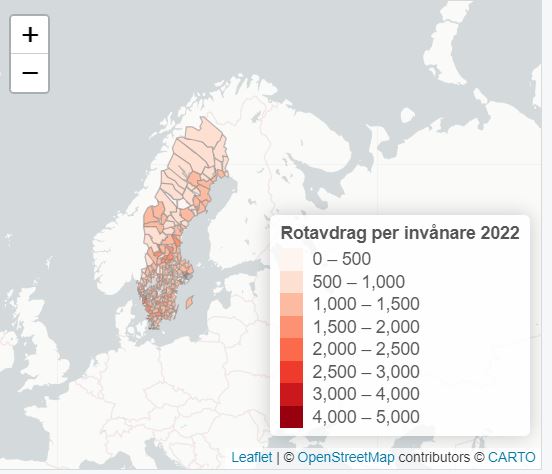
I'm trying to create an interactive map over the municipalities in Sweden using leaflet. I have made the map, see code below. However the rest of the world is still visible on the output of the map. I would like to be able to only include Sweden as the country in the output, such that you can't zoom out/move around on the rest of the world. Preferably with a white background.
The data I have used is an excel document with the data I want as output in my map, and this map with MultiPolygon coordinates over the municipalities from here: ggmap, tidy verse: "non-USA countries" with county, municipality, subregion data? - #2 by mfherman.
Here is my code:
library(leaflet)
library(sf)
library(RColorBrewer)
library(leaflet.providers)
library(htmltools)

#Define the number of bins
mybins <- c(0,500,1000,1500,2000,2500,3000,4000,5000)
# Define the color palette
pal <- colorBin(palette = "Reds", domain = joined_df2$rot_inv, bins=mybins)

#Create labels
myLabels <- paste("<strong>", joined_df2$mun_name, "</strong>", "<br/>",
                  "Rotavdrag (milj kr):", joined_df2$rot_kost,"<br/>", "<br/>",
                  "Rotavdrag per invånare (kr):", joined_df2$rot_inv, "<br/>", "<br/>",
                  "Riksgenomsnitt (kr/inv):", joined_df2$rot_rik
                  ) %>% lapply(htmltools::HTML)

# Create a leaflet map with custom tile layer
map <- leaflet() %>%
  addProviderTiles(providers$CartoDB.PositronNoLabels, options = providerTileOptions(noWrap = TRUE)) %>%
  setView(lng = 16.745, lat = 60.128, zoom = 5)

# Add polygons to the map
map <- map %>%
  addPolygons(
    data = joined_df2,
    fillColor = ~pal(joined_df2$rot_inv),
    color = "grey",
    weight = 1,
    opacity = 0.5,
    fillOpacity = 1,
    highlight = highlightOptions(
      weight = 3,
      color = "grey",
      fillOpacity = 0.8,
      bringToFront = TRUE),
    label = myLabels,
    labelOptions = labelOptions(
      style = list("font-weight" = "normal", padding = "3px 8px"),
      textsize = "11px",
      direction = "auto")
  )

# Add the legend
map <- map %>%
  addLegend(
    "bottomright",
    pal = pal,
    values = joined_df2$rot_inv,
    title = "Rotavdrag per invånare 2022",
    position = "bottomright",
    opacity = 1
  )

# Print the map
map
And here is the output:

Appreciate your help!