For a Fisheries Research class project, I am using R to get p-values for linear and non-linear regressions. I have successfully gotten p-values for linear and logarithmic regressions, and the equations matched the regressions I did in excel to check.
Despite some success, I have had some troubles with exponential and power function regressions. I have gotten outputs for both, but the estimated parameters are very different from the ones I got in Excel. I've included the code that I've been using for each regression type below.
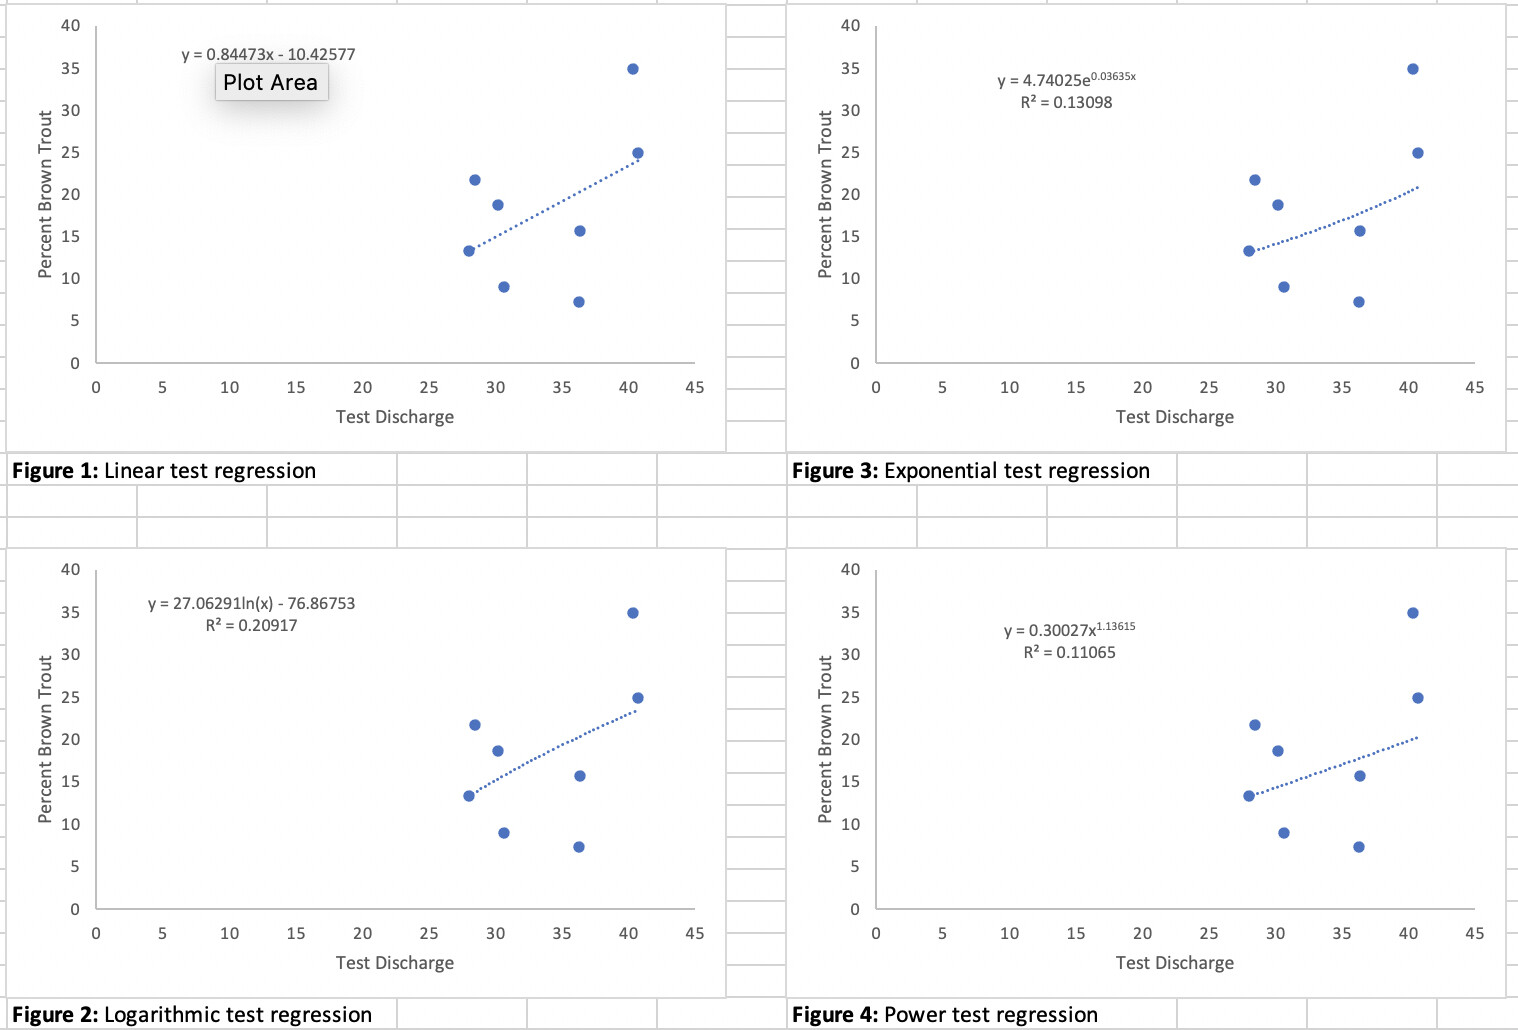
As additional context, I am doing regressions with percent brown trout (p_brown) on the y axis and environmental conditions on the x axis. I have named the environmental conditions as follows: season_condition_extreme. For example, fa_d_max would correspond to fall_discharge_maximum.
Linear (works & matches Excel)
plot(p_brown~fa_d_max)
linreg_fa_d_max <- lm(p_brown~fa_d_max)
abline(linreg_fa_d_max)
summary(linreg_fa_d_max)
Logarithmic (works & matches Excel)
plot(p_brown~su_d_max)
logreg_su_d_max <- nls(p_brown~a*log(su_d_max)+b,
                       start = list(a = 4, b = -2))
summary(logreg_su_d_max)
Exponential (works, but doesn't match Excel)
Excel regression: y = 5.6287 * e^(0.0325 * x)
R regression: y = 7.248 * e^(0.0271 * x)
plot(p_brown~sp_d_min)
expreg_sp_d_min <- nls(p_brown~a*exp(b*sp_d_min),
                       start = list(a = 5, b = 0))
summary(expreg_sp_d_min)
Power (works, but doesn't match Excel)
Excel regression: y = 3.4559 * x^(0.4272)
R regression: y = 7.5279 * x^(0.2282)
plot(p_brown~fa_d_min)
powreg_fa_d_min <- nls(p_brown~a*(fa_d_min^(b)),
                       start = list(a = 3.5, b = .4))
summary(powreg_fa_d_min)
I appreciate any help or pointers that I can get. My experience in R is minimal, so this is all very new to me. Thanks!