Dear all,
I want to create a nomogram/3-d surface showing the probability of being male by weight and height.
set.seed(1234)
df <- data.frame(
sex=factor(rep(c("0", "1"), each=200)),
weight=round(c(rnorm(200, mean=55, sd=5),
rnorm(200, mean=65, sd=5))),
height=round(c(rnorm(200, mean=160, sd=10),
rnorm(200, mean=170, sd=10)))
)
library(rms)
lm3 <- rms::Glm(sex ~ weight + height, data=df, family="binomial")
plot(nomogram(lm3, weight=seq(40,100,by=2), height=seq(150,200,by=5), fun=plogis, lp="Prob of being male"))
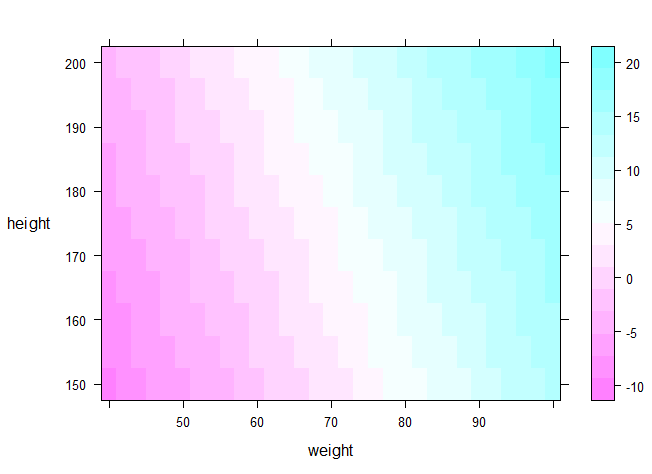
bplot(Predict(lm3, weight=seq(40,100,by=2), height=seq(150,200,by=5)))
Problem 1: I do not manage to make the "outcome" axis "logarithmic".
Problem 2: I need to set certain limits for the continuous variables. Is there any default? The nomogram-Code does not work currently.
Current example for the bplot (on the right, the "outcome"/dependent variable is not logarithmic?
Thank you for your help!
Yours,
Georg