Hi everyone.
I've got a flexdashboard using shiny from a couple of years back, before the big expansion of the tidyverse.
I'm looking at updating it to streamline things a bit, and I feel like some of the ways I did things were a bit of a kludge because either I didn't know any better, or possibly because the packages weren't around when I made the dashboard.
The basic workflow is as follows:
Data: Monthly measures of a rate of use for 45 different antibiotics, across five different hospitals
Currently stored in an excel spreadsheet, 5 tabs, rows 01-mmm-yy, columns the antibiotics, cells the usage
The dashboard imports the xlsx into five data frames, one per tab, then "tidies" them into frames:
> str(hosp1)
Classes ‘tbl_df’, ‘tbl’ and 'data.frame':	5580 obs. of  4 variables:
 $ date      : POSIXct, format: "2006-01-01" "2006-02-01" "2006-03-01" "2006-04-01" ...
 $ antibiotic: chr  "dicloxacillin" "dicloxacillin" "dicloxacillin" "dicloxacillin" ...
 $ usage     : num  17.58 5.47 31.63 5.29 9.72 ...
 $ hospital  : chr  "hosp1" "hosp1" "hosp1" "hosp1" ...
>
These frames then form the working files for the dashboard - which is mostly done by individual hospital, with drop-downs to select what appears on the graph.

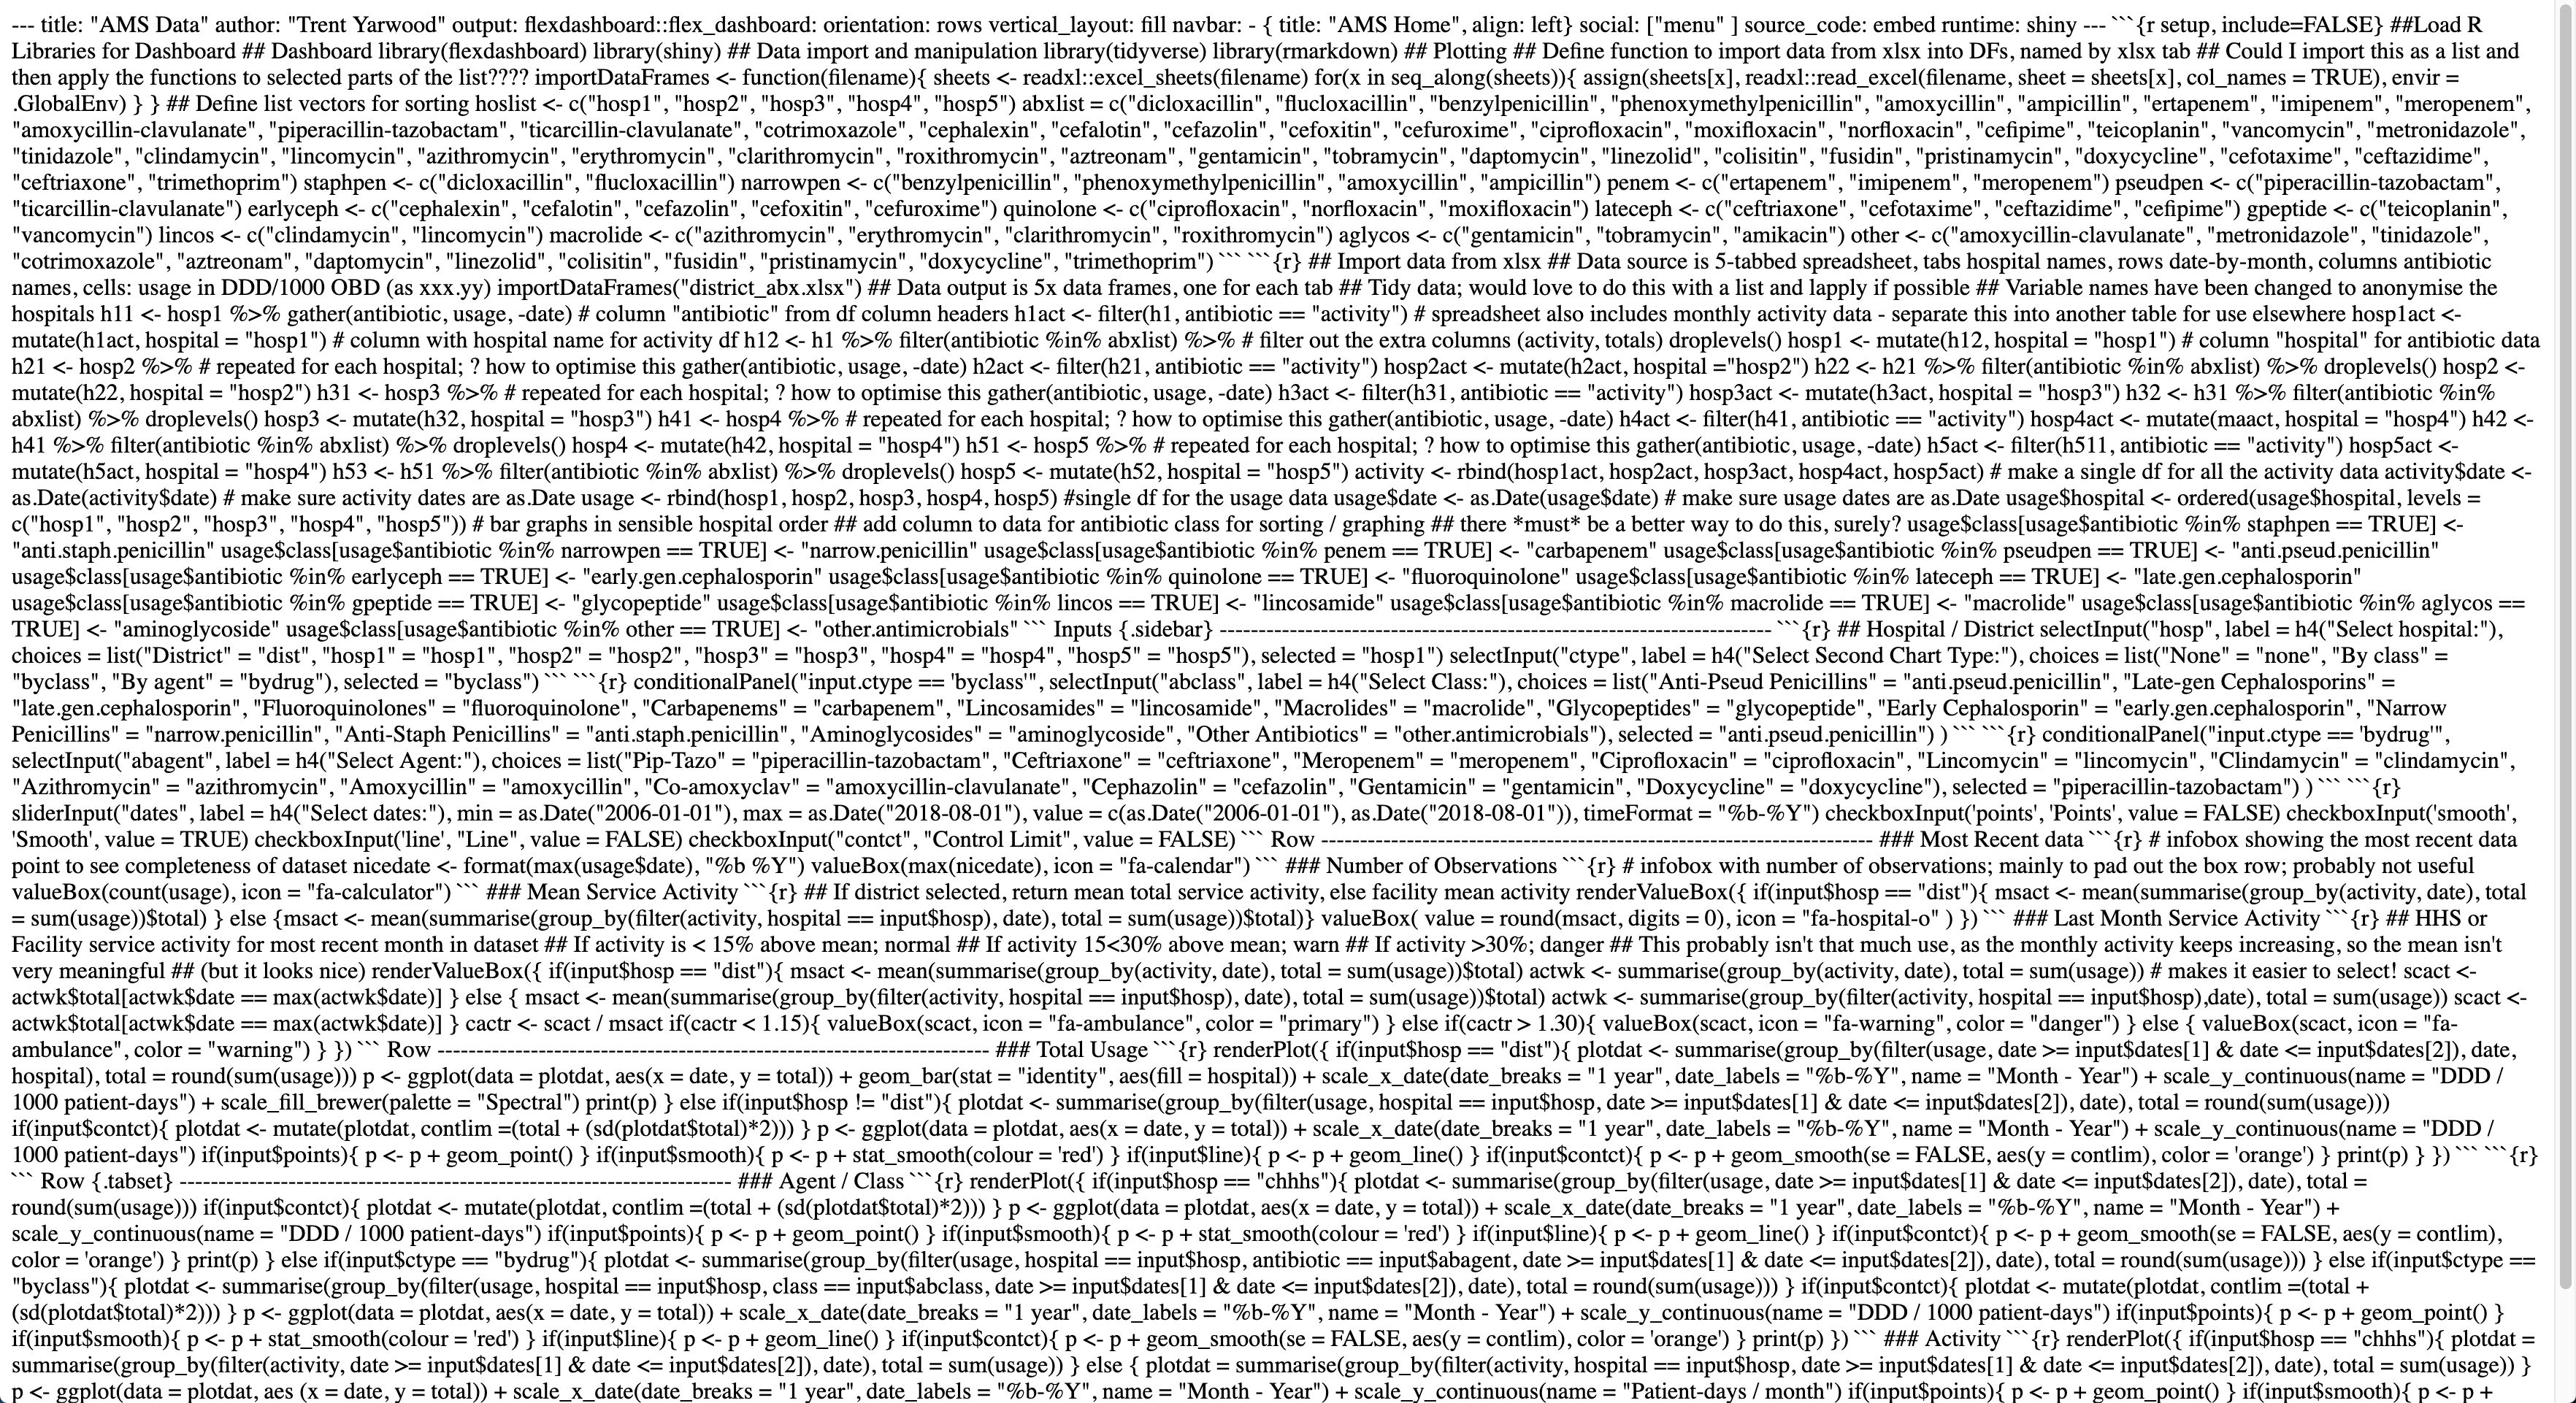
Code is available here
and the sample datafile is here.
My specific questions are:
- Is there a way to import the data directly into a list that I could then apply the functions across altogether rather than repeating it the way I have?
- Is there an even more elegant way of doing it than that?
- there are also a couple of my ponderings inline in the code about easier ways of doing things.
I know this is vague and without reprex, but I'm trying to come up with a more streamlined way of doing things while getting to grips with all the new tidyverse commands!
Thanks in advance.
[edit fixed the broken code link]