Hi, I'm sorry if yo think this task is basic but I have issues with nested tables which might be exported to excel.
I have this data frame:
source <- data.frame(
   stringsAsFactors = FALSE,
            Jobcard = c(5660863,6325219,5725499,
                        5901064,5894979,6103468,5980049,6024022,5879135,
                        6322768,5501653,6198477,6139052,6206653,6311497,
                        5982023,6221379,5526636,5972438,5972654,5985139,5540807,
                        6182714,6068033,6068050,5921431,6391584,6028502,
                        6326756,5631504,6028639,5817717,6300466,6078360,
                        6341502,5930502,6081264,5906791,5943518,5947278,
                        5980451,5972703,6045056,5723754,5816699,5895124,6291001,
                        5577294,6140149,6243126,6398292,5656335,6096748,
                        6226194,6293398,5500038,6137288,5882662,6025331,
                        5621709,6118401,5686104,6244837,5662066,5665621,
                        5650764,5679383,5653473),
  SourceCategoryCat = c("Web Booking","Web Booking",
                        "Call","Other","Web Booking","Web Booking",
                        "Web Booking","Call","Web Booking","Web Booking","Call",
                        "Call","Web Booking","Web Booking","Web Booking",
                        "Web Booking","Web Booking","Call","Call","Call","Call",
                        "Call","Call","Call","Call","Call","Call",
                        "Web Booking","Web Booking","Call","Call","Call","Call",
                        "Web Booking","Web Booking","Call","Other",
                        "Web Booking","Web Booking","Call","Call","Web Booking",
                        "Other","Call","Call","Call","Call","Call","Call",
                        "Web Booking","Web Booking","Web Booking","Web Booking",
                        "Web Booking","Web Booking","Call","Call","Call",
                        "Other","Web Booking","Web Booking","Call","Call",
                        "Call","Other","Call","Call","Web Booking"),
               Year = c(2021,2022,2021,2021,2021,
                        2022,2022,2022,2021,2022,2021,2022,2022,2022,
                        2022,2022,2022,2021,2022,2022,2022,2021,2022,
                        2022,2022,2021,2022,2022,2022,2021,2022,2021,2022,
                        2022,2022,2021,2022,2021,2021,2022,2022,2022,
                        2022,2021,2021,2021,2022,2021,2022,2022,2022,
                        2021,2022,2022,2022,2021,2022,2021,2022,2021,2022,
                        2021,2022,2021,2021,2021,2021,2021),
              Month = c(10,8,10,12,11,3,1,2,
                        12,8,8,5,4,5,7,1,6,9,1,1,1,8,5,3,3,12,8,
                        2,8,9,2,11,7,3,8,12,3,12,12,1,2,1,2,11,
                        11,12,7,8,4,7,8,9,4,6,7,8,5,11,2,9,4,
                        10,6,9,10,10,10,9),
                NPS = c(0,-100,-100,-100,100,100,
                        100,-100,100,100,0,100,100,-100,100,100,-100,
                        100,100,-100,0,100,-100,100,100,100,0,100,
                        100,-100,100,100,0,100,0,100,0,0,-100,100,
                        -100,100,-100,100,100,-100,100,0,100,0,-100,
                        100,100,100,100,0,-100,0,-100,0,100,0,0,
                        100,-100,-100,-100,100),
       ResponseDate = c("2021-10-02","2022-08-11",
                        "2021-10-29","2021-12-15","2021-11-24","2022-03-23",
                        "2022-01-25","2022-02-24","2021-12-01","2022-08-03",
                        "2021-08-06","2022-05-26","2022-04-21","2022-05-28",
                        "2022-07-16","2022-01-27","2022-06-24","2021-09-10",
                        "2022-01-25","2022-01-13","2022-01-21","2021-08-08",
                        "2022-05-20","2022-03-05","2022-03-07","2021-12-09",
                        "2022-08-26","2022-02-26","2022-08-04","2021-09-07",
                        "2022-02-16","2021-11-05","2022-07-11","2022-03-24",
                        "2022-08-17","2021-12-18","2022-03-25","2021-12-05",
                        "2021-12-30","2022-01-01","2022-02-02","2022-01-12",
                        "2022-02-25","2021-11-09","2021-11-30","2021-12-03",
                        "2022-07-06","2021-08-26","2022-04-25","2022-07-06",
                        "2022-08-31","2021-09-30","2022-04-06","2022-06-13",
                        "2022-07-05","2021-08-24","2022-05-05","2021-11-24",
                        "2022-02-15","2021-09-10","2022-04-04","2021-10-13",
                        "2022-06-21","2021-09-24","2021-10-18","2021-10-30",
                        "2021-10-30","2021-09-27")
)
Now, I need two tables (or one) which could be easily exported to excel which column percentages and counts (ideally in one table), where first variable on the left is SourceCategoryCat and the second is NPS. At the top, I need a Year and underneath a Month (perhaps there is a clever way of using ResponseDate variable to show that rather then converting a date into Year and Month.
I can do it only this way:
library(dplyr)
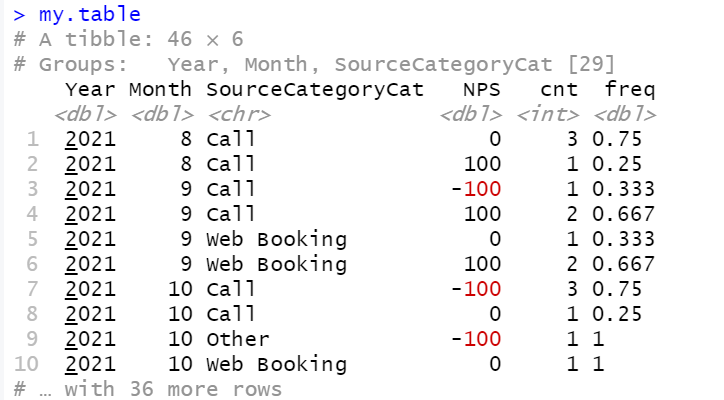
my.table <- source %>%
group_by(Year, Month, SourceCategoryCat, NPS) %>%
summarise(cnt = n()) %>%
mutate(freq = round(cnt / sum(cnt), 3))
my.table
but this is not very handy to create a trend table with a date at the top.
I can easily do it in SPSS and perhaps in excel pivot tables. Can I do it in R?