Nested Commands Using the Ggplot2 package inside the Tidyverse Package

Hey everyone, I have been using a tidy verse syntax for a while now but have been trying to familiarize myself with nested commands as well. I'm working with the "starwars" dataset in R, and my question is, where do I put the filter function so that I only see the amount of people per "feminine" and "masculine" and don't see the NA in my x-axis? I know I could also use the drop_na() function, but if I know where filter goes, I'm assuming I'll figure out the same with the drop_na() function. Thank you.

My current syntax:

ggplot(data = starwars, aes(gender, fill = gender))+
geom_bar()

My current results:

You can use the dplyr function filter to get rid of the rows with NA's. filter(!is.na(gender)) keeps only rows where gender is not NA. Here's some info on the filter function Keep rows that match a condition — filter • dplyr

library(ggplot2)
library(dplyr)
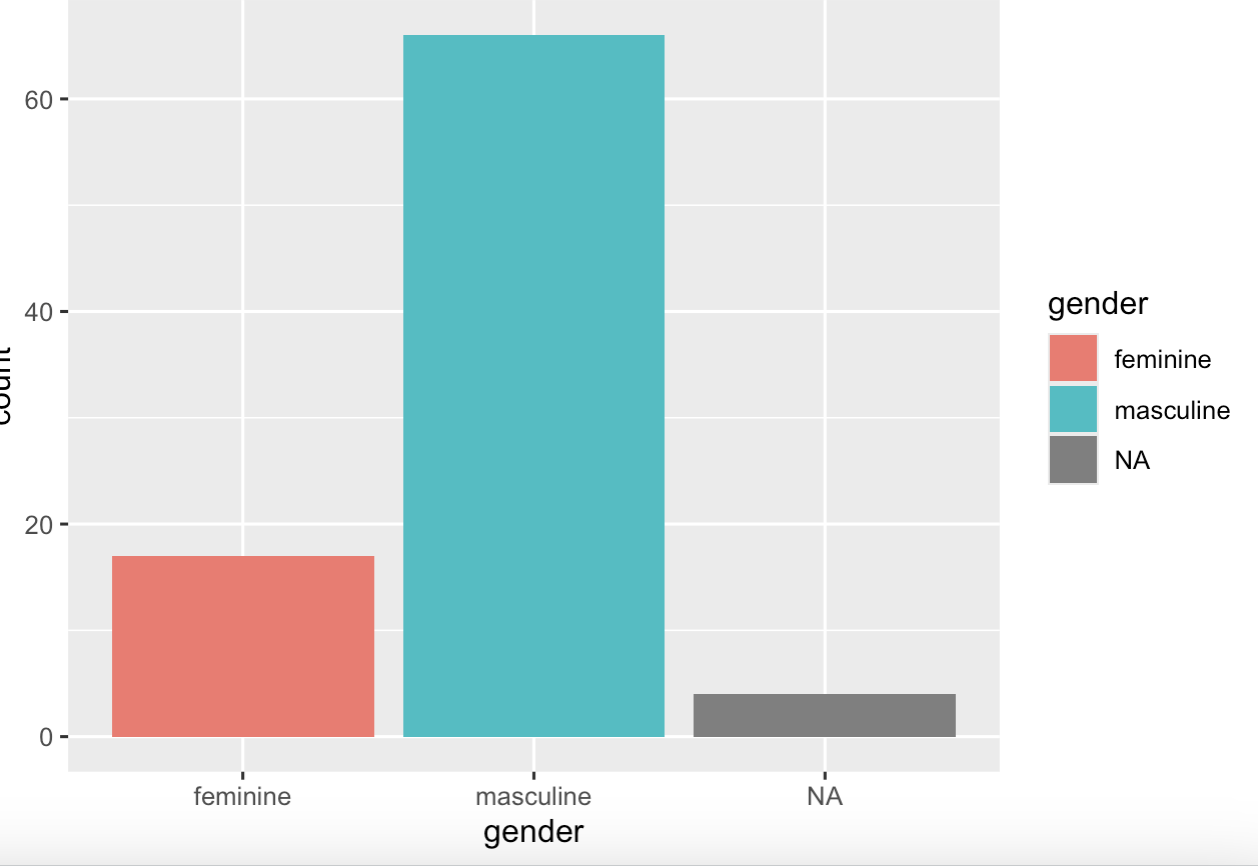
starwars_withouts_nas <- starwars %>% filter(!is.na(gender))
ggplot(data = starwars_withouts_nas , aes(gender, fill = gender))+
  geom_bar()

Or if you want to use the drop_na function you could do:

library(tidyr)
starwars_withouts_nas <- starwars %>% drop_na(gender)
ggplot(data = starwars_withouts_nas , aes(gender, fill = gender))+
  geom_bar()

If you want to do it without creating an intermediate variable like starwars_without_nas, you could do

ggplot(data = starwars %>% filter(!is.na(gender)), aes(gender, fill = gender))+
  geom_bar()

or

ggplot(data = starwars %>% drop_na(gender), aes(gender, fill = gender))+
  geom_bar()

An alternative way to do it would also be:

starwars %>% filter(!is.na(gender)) %>% ggplot(aes(gender, fill = gender)) +
  geom_bar()

and

starwars %>% drop_na(gender) %>% ggplot(aes(gender, fill = gender)) +
  geom_bar()

If you aren't familiar with the pipe,%>%, this is a good place to start to learn how to use it https://r4ds.hadley.nz/data-transform.html#dplyr-basics and https://r4ds.hadley.nz/data-transform.html#sec-the-pipe. The sections from R For Data Science 2nd edition that I linked to use the base R pipe, |>, but pretty much all the code using the native pipe in that tutorial will work the same using the magrittr pipe %>%. I'm just so used to writing code with the magrittr pipe that I haven't switched over to the base R pipe since it is pretty new. :slight_smile:

1 Like

Thank you! I will definitely use and keep these options in mind! I am actually aware of the pipe operator, but would it be possible to solve my problem without a pipe operator and just purely nested commands?

Absolutely! I'm so used to using the pipe that I pretty much always use it instinctively. I think it makes code easier to read. But you could do

ggplot(data = drop_na(starwars, gender), aes(gender, fill = gender)) +
  geom_bar()

or

ggplot(data =  filter(starwars, !is.na(gender)), aes(gender, fill = gender)) + 
  geom_bar()

The first argument to both the filter and drop_na functions is the name of the data.frame.
filter(starwars, !is.na(gender)) is the same as starwars %>% filter(!is.na(gender)) because the variable to the left of %>% is inserted as the first parameter in the function to the right of %>%. So for the same reason drop_na(starwars, gender) is equivalent to starwars %>% drop_na(gender)

And if you want to create intermediate variables, you could create variables from drop_na(starwars, gender) or filter(starwars, !is.na(gender)) and pass them to the data argument to ggplot.

1 Like

This topic was automatically closed 21 days after the last reply. New replies are no longer allowed.

If you have a query related to it or one of the replies, start a new topic and refer back with a link.