Need to tidy data imported from Excel

Hello everyone! New to R here :slight_smile:
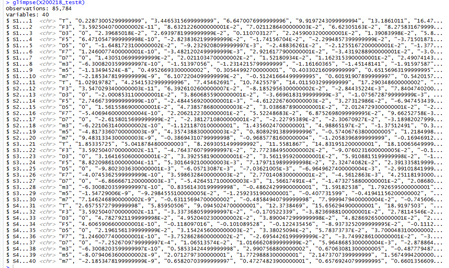
i am trying to get a tidy dataset while importing data from Excel. This is how my excel file look like:

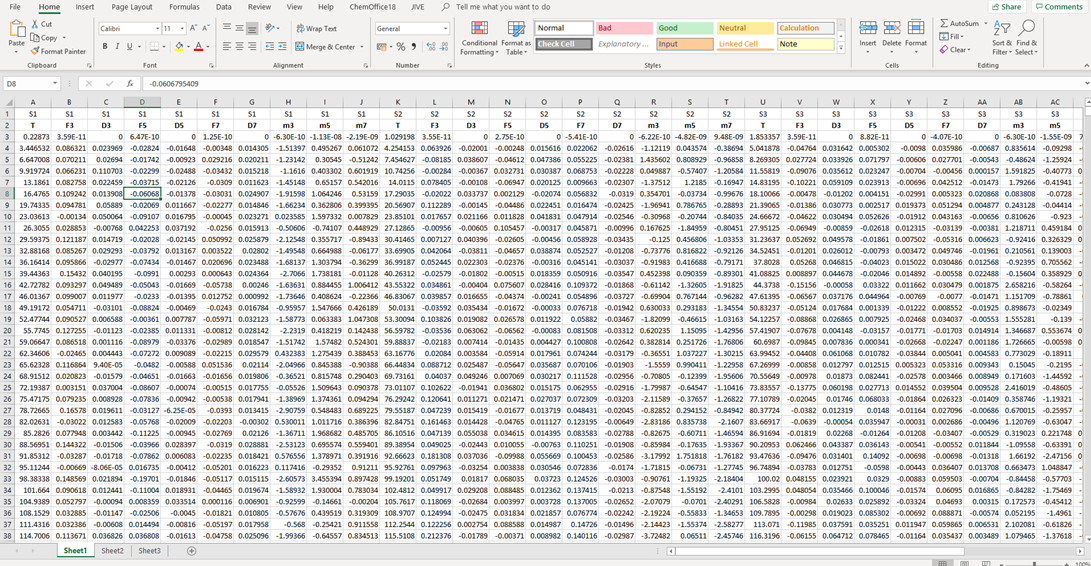
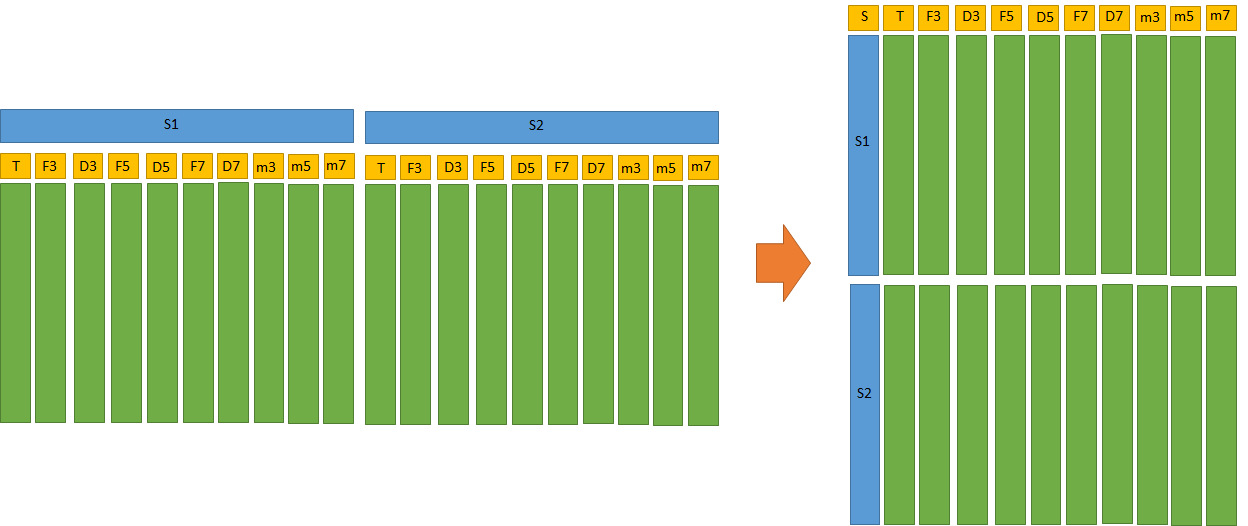
Briefly, I have 9 variables (T, F3, D3, F5, D5, F7, D7, m3, m5, m7) for 4 different sensors (S1, S2, S3, S4, first row in Excel), and I would like to have a dataset with a column named "sensor", whose observations will be S1, S1, S1.. S2 S2.. etc. and then nine more column named T, F3, D3, F5, D5, F7, D7, m3, m5, m7. I tryed to use:

dataframe_tidy <- gather(dataframe, Sensor, F3, D3, F5, D5, F7, D7, m3, m5, m7)

and I get:

Error in .f(.x[[i]], ...) : object 'F3' not found

Does someone have an idea on how I can do it?

Hi @vivvi, welcome to RStudio Community.

The error message is clear; dataframe does not contain a variable named F3. I suspect that the first row of your Excel sheet (containing sensor names) has been imported as the column headers while the second row (containing the readings) has become an observation.

Can you please post the output of glimpse(dataframe) for us to have a look at the structure?

It can be difficult to import the 2 header rows. Either the first one is skipped or the second one will be treated as NA (as these do not match to the numbers in the following rows) or all columns are imported as character, still generating some problems.

I would say the easiest way is to transpose the file directly in Excel and import the transposed one.
Clearly if you need to repeat this for many files you may need an solution that works in R.

PS: Hmm, but then you have a different column for each replicate (are these replicates?) moving the difficulty to another aspect of your data..

Providing a reprex would be a good idea.
FAQ: How to do a minimal reproducible example ( reprex ) for beginners

Hi @siddharthprabhu, thanks for your answer!
this is what I get:
image
Yes, as you said, the first row (sensor names) has been imported as the column header while the second row (readings) has become an observation. What I would like to do is to transform the sensor as an observation, so that instead of having 40 variables (or 40 columns, equal to 10 variable per sensor), I have only 11 variables, the 10 original variables + the sensor). I am not sure I am being clear :sweat_smile: :sweat_smile: :sweat_smile:

Actually this is what I would like to do (approx at 2 sensors):

I can exchange the headers or importing it not as headers in case, but with the same gather() function I did not obtain any result...

I think the easiest way to tackle this problem would be to import the two header rows and the rest of the data separately. We can then combine the headers to get a single column header. That will get our data into a form that will easily allow the other transformations.

I've uploaded a sample Excel file that mimics your data here. Place it in your working directory and try running through the code below.

library(tidyverse)
library(readxl)

# Read only the header rows.
headers <- read_excel("data_sample.xlsx", col_names = FALSE, n_max = 2)

# Create a header vector by concatenating them.
header_names <- map_chr(headers, str_c, collapse = "_")

# Read the data rows.
data <- read_excel("data_sample.xlsx", col_names = FALSE, skip = 2)

# Assign the generated header names to the data frame.
names(data) <- header_names 

print(data)
# A tibble: 6 x 6
   S1_T S1_F3 S1_D3  S2_T S2_F3 S2_D3
  <dbl> <dbl> <dbl> <dbl> <dbl> <dbl>
1    90    14    70    43    96    99
2    70     3    32    90    55    61
3    81    66    20    77    73    84
4    83    61    70    72    58    16
5    93    18    96    55    96    29
6    30     3    39    48    68    59

# Transform the data.
pivoted_data <- data %>% 
  rownames_to_column() %>% 
  pivot_longer(cols = -rowname) %>% 
  separate(name, into = c("sensor", "measure")) %>% 
  pivot_wider(names_from = measure, values_from = value)

print(pivoted_data)
# A tibble: 12 x 5
   rowname sensor     T    F3    D3
   <chr>   <chr>  <dbl> <dbl> <dbl>
 1 1       S1        90    14    70
 2 1       S2        43    96    99
 3 2       S1        70     3    32
 4 2       S2        90    55    61
 5 3       S1        81    66    20
 6 3       S2        77    73    84
 7 4       S1        83    61    70
 8 4       S2        72    58    16
 9 5       S1        93    18    96
10 5       S2        55    96    29
11 6       S1        30     3    39
12 6       S2        48    68    59

Note: pivot_longer() is the modern gather() while pivot_wider() is the spread() equivalent. It would be good to familiarize yourself with these new kids on the block as they are easier to use and more powerful.

I can't run your code without a reprex (see link in @nirgrahamuk's comment), but there is a new package, unheadr, that has helper functions to address this situation (intro vignette here).

1 Like

Sorry for the late reply but needed to switch to another project due to a deadline.. I am now back at it.
I tried what you proposed and indeed it owrks well, though I then find myself with only 3 variables, instead of the 11 I would like to have (Sensor, T, F3, D3, m3, F5, D5, m5, F7, D7, m7).
basically, my point is that I want to plot F3, D3, m3, F5, D5, m5, F7, D7, as a function of T for the various sensors, and I think by having this structure I could more easily write the code, as I can group_by() sensor etc.

@vivvi The approach I've suggested should work fine even for a data set with 11 variables. It's just that the toy example I used for demonstration only had 3 variables.

Can you state exactly what difficulties you are facing in adapting the code to your data set?

Actually my point is that I do not want a variable named "measure", but rather that each type of mesurement is a variable itself..

OK. That can be easily accomplished by adding a call to pivot_wider(). I've edited my earlier post. Please see if that does what you need.

This topic was automatically closed 21 days after the last reply. New replies are no longer allowed.