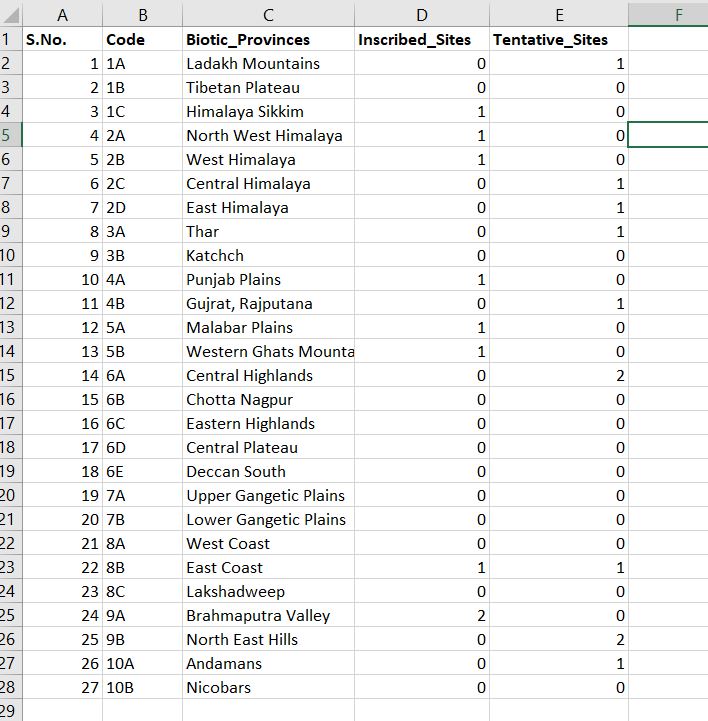
I have this data and i want to represnt this data using rstudio which should be aesthetically pleasing also
the values are mostly zero...
Yes it is the case as number of inscribed and tentative sites are few
do a bar chart that has 3 bars for counting how many locations have zero sites, one site, or two sites ?
1 Like
This topic was automatically closed 21 days after the last reply. New replies are no longer allowed.
If you have a query related to it or one of the replies, start a new topic and refer back with a link.