I have around 200 CSV files containing data from vulnerability assessment with similar headings. There are about 20 headings on each file. The most important headings in the files are IP addresses, Ports, Severity and Vulnerability Synopsis. Each file represents a location in a single assessment. My goal is to combine all the files for R to analyze and generate useful trends for me.
One thing that I can't figure out is to assign date to each file. The files do not have date under any of the headings. These files dated since 2015 until this year where the assessment is done twice a year in April and October session. Each session will generate around 20 files so all of them have the same date.
I want to see these trends from R analysis:
IP addresses which found in all the files, meaning always vulnerable
IP address with most vulnerabilities
Vulnerabilities which persist in all files
The number of IP addresses which appear in one file and not the next for example found in April 2016 files but not in October 2016 files.
I need some guidance on how to achieve this. Thank you in advanced for any help offered.
If you use the function file.info() you can get three relevant datetime variables back: mtime, ctime, atime, which are integers of class "POSIXct": file modification, ‘last status change’ and last access times. This will give you a programmatic way to generate the dates of the files, which you can then group into the April and October sessions by filtering on the date.
As for the other trends you've listed, you could use dplyr::group_by() and various mutate() and summarise() functions to get most of the summaries you're describing.
Thank you so much for the tips. I am currently reading the e-book and practicing the examples.
As for the file date, I do not think I can use the file.info() as the CSV files are generated at a later date which is not when the assessment was conducted, for example the CSV files for April 2016 may be generated only when needed in 2019. Do you have any suggestion how to solve this?
If the date is indicated in the filename, you could read them in using a workflow like the one discussed in the post below:
There are good instructions as to how exactly you would execute that under the section heading Add a source indicator. If you're using purrr, you set the .id parameter for the map_dfr() function to indicate the sourcefile.
That is pretty simple, I have done similar stuff since I am also in security. Here is I function I wrote for reading and processing lots of files. csv or xlsx.
# Function to generate datatable using newest csv
read_newest_file <- function(dir_with_files, pattern){
  df <- file.info(dir(dir_with_files, pattern = pattern, full.names = T))
  return(rownames(df))
}

dir_with_files <- "./results" # Directory with files
current_files <- read_newest_file(dir_with_files, "^cve" )
for(file in current_file){
  print(file)
  #data.table <- fread(current_file)
}
It depends on which assessment the files belong to. If it is assessment April 2016 then I would want to assign the file date as Jun 2016. Later I would want to have the dates as x-axis for the graph for example x-axis values would be April 2015, October 2015, April 2016, October 2016 and so on...
Thank you for for the recommendations. I will try to understand it and apply it later if possible.
Thank you for your help. I am very newbie in R so I will need to take sometime to understand your codes. Could you point me to a guide that can explain your codes in more details?
Which one do you want to understand? The one for reading files in a directory or for creating files with dates?
In the mean time, learn R by doing. Create a new directory in your current directory and call it results. Next copy couple or more csv files in that directory. ^cve means file names start with cve. Or you could change pattern based on your file names. Copy the code and run, once you see that, it will be easy to explain everything later. That is what I do when I do not understand R, Python, etc.
Once you run it successfully, let me know and I will help you understand code by showing you how to use R help. You will have to type the following in R Console:
?dir()
?file.info() -> Click on Extract File Information
In the code above I am not really using file.info() I left in there cause your use case does not need file infor, I presume.
Actually I am trying to understand both codes. I kind of have some ideas now how it works after analyzing it. My plan is to go through the e-book Mara suggested earlier but I can try your suggestion first.
My csv files are generated with Nessus. All csv files in the directory should be uploaded to R but each one's date should be the assessment date for the reason I explained in my previous posts. I am not really sure where the date is assigned to the file, is it as one of the variables in the file or maybe a metadata of the file..
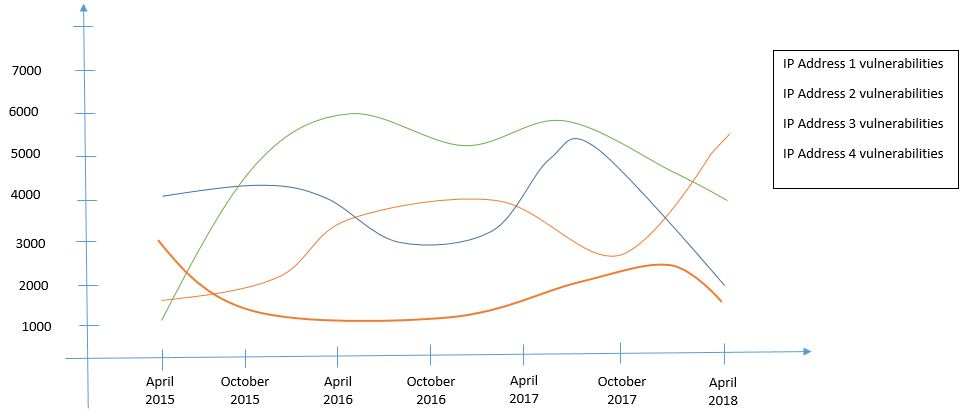
My goal is to have x-axis values to be the assessment dates and y-axis values to be various variables such as number of vulnerable IP addresses, number of severity, type of vulnerabilities and so on so that I can get some trends to predict patterns of threats in my network.
If you have suggestions on how to achieve this I would appreciate it very much.
Zorro, this is Luffytaro Here is what you need to create a dataframe with that information. This should work as long as you point it to a directory with csv files.. You will have to change pattern based on whatever name your files start with or any approach you want.
# Function to generate datatable using newest csv
read_newest_file <- function(dir_with_files, pattern){
  df <- file.info(dir(dir_with_files, pattern = pattern, full.names = T))
  df$filename <- basename(row.names(df))
  return(df)
}

dir_with_files <- "./results" # Directory with files
current_files <- read_newest_file(dir_with_files, "^cve" )
rownames(current_files) <- NULL # remove rownames
current_files <- current_files[,c(11, 4:6)]

# mtime integer of class "POSIXct": file modification,
# ctime ‘last status change’
# atime last access times.
print(current_files)
Yes, I understand that but I need help on how to manually assign past dates to the files so that I can make the dates as values for the x-axis of the graph.
Not sure what you are asking. Do you mean assign past dates in the data.table? If you mean that, you keep tracking of past date by creating columns that have those dates
The x-values for graphs generated from the data should be the dates assigned to the files. My problem is the files themselves do not have any date associated with them except the mtime,ctime and atime you mentioned before but the files are only recently created so the dates are not the dates of actual assessments which were a few years back. So I cannot use mtime,ctime and atime because the files are supposed to have dates like April 2016 or October 2016. So is the only correct way to assign the past date to each file data is by manually assigning it in the data.table? If yes, how do I do that?
Are you using Synopsis for Static Code Analysis? Can you set it such that the moment the scan finishes, it generates a report? With that you have your mtime. Use your mtime as your date for the file. That is the best I can help you. I do not know your use case. If you had something to show how you want it to look, that would help. I have changed the code to create a column for date using mtime. Good luck
Y-axis is the number of vulnerabilities for IP addresses. X-axis is the the assessment date. As I mentioned earlier, the data itself does not have any dates so I need to add dates into the data in R for the X-axis values.
My data is coming from almost 200 CSV files where around 20 files belong to one assessment and one X-axis value represents one assessment. The csv files have data like IP addresses, ports, vulnerabilities, CVE, Severity and others. I hope it is clear now why I wanted to have the dates for the data.
One other thing is I have tried mydata = read.csv("./results/csvfile") and able to plot things like IP address vs Risk. How do I see the contents of the files using your codes?