Hi
I am trying to make a forest plot based on binary regression data.
I am running this code but providing me with error caution.
table$Subgroup <- ifelse(is.na(table$Odds ratio),
table$Subgroup,
paste0(" ", table$Subgroup))
plot(left_side_data = table (,1),
estimate = table$ 'p value',
ci_low = table$'CI low',
ci_high = table$'CI high',
display = FALSE,
xlim = c(-100, 25),
file_path = here::here("C:/Users/lenovo/Desktop/forester_plot.png"))
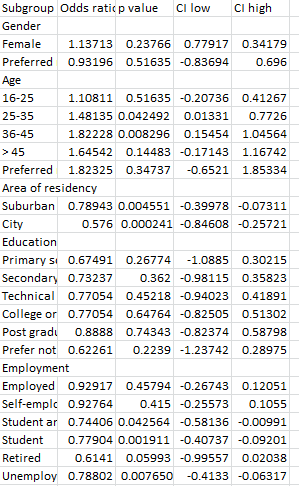 this is the data set.
I want to plot p value and odds ratio along with 95% confidence interval.
Someone please help me by providing necessary codes
Thanks in advance.