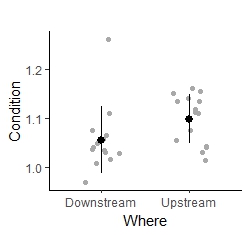
I have created this plot using ggplot in R and am struggling to get a polished finish:
I exported the file as a JPEG and PNG and it always seems a little pixelated, especially the black circle, is there an easy way to fix this? I would also like to add horizontal lines on the error bars.
Here is the code I used:
library(ggplot2)
theme_set(
theme_classic() )
jpg or png always converts the plot into a raster-image, at some point it will always be pixelated, the question is how much is acceptable.
I would suggest to use the ggsave() function, here you can define the output dimensions of the plot, using the width and height arguments (carfully, when just increasing the size the size of points, linewidth, fonts shrinks proportionally and may need adjustment) and the resolution (pixel per area) of the plot using the dpi argument.
Increasing the dpi to 600 or 1200 adds more pixels, decreases the pixelation and increases the file-size.
device Device to use. Can either be a device function (e.g. png or one of "eps", "ps", "tex"(pictex), "pdf", "jpeg", "tiff", "png", "bmp", "svg" or "wmf" (windows only).