need help: ggplot

Hi. I'm new to R and was looking for help. I was hoping to create a scatterplot using two variables (danceability and popularity), however, when I run the code, it includes all of the variables in the csv, even though I have defined the x and y variables. Below is the code:

#Section 1 - 1.1
df <- read.csv("spotify_dataset.csv")
print(df)

#Section 1 - 1.2

set.seed(1008444239)

sample(1:112,1)
#The number I received from the sample is 49

unique(df$track_genre)

my_regression_df <- df[df$track_genre == "hardcore",]

#Section 1 - 1.3

sample(1:112,2)
#The two numbers that I received from the sample are 22 and 47

unique(df$track_genre)

my_group_diff_df <- df[df$track_genre == "dancehall" | df$track_genre == "happy",]

#Section 2 - 2.1

my_regression_df <- read.csv("spotify_dataset.csv")

install.packages("ggplot2")
library(ggplot2)

plot1 <- ggplot(data=df, aes(x=popularity, y=danceability)) + geom_point()
plot1

plot1_x <- ggplot(data=my_regression_df, aes(x=popularity, y=danceability)) + geom_point() +
xlab("popularity index")
plot1_x

plot1_y <- ggplot(data=my_regression_df, aes(x=popularity, y=danceability)) + geom_point() +
xlab("popularity index") + ylab("danceability index")
plot1_y

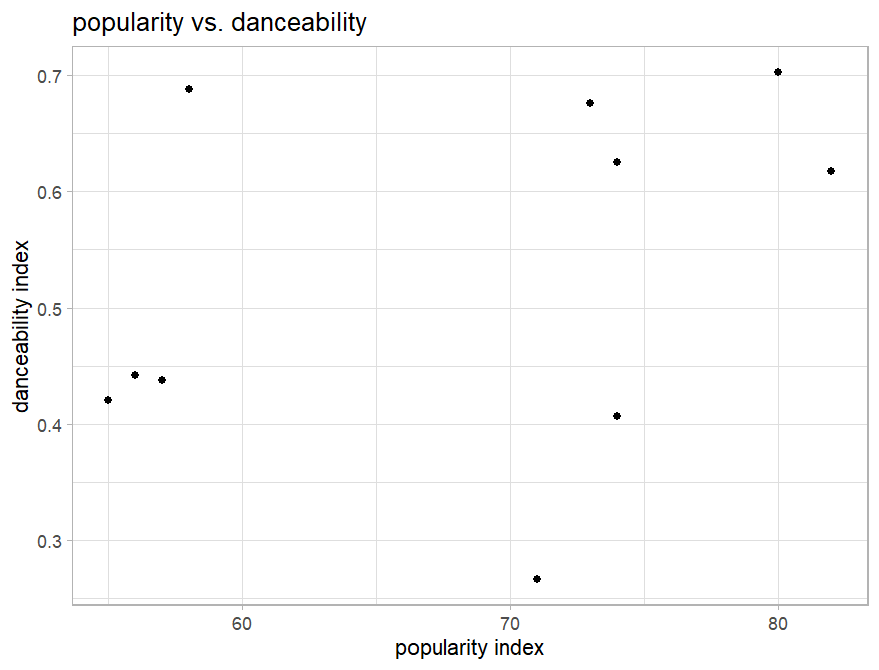
plot1_title <- ggplot(data=my_regression_df, aes(x=popularity, y=danceability)) + geom_point() +
xlab("popularity index") + ylab("danceability index") + ggtitle("popularity vs. danceability")
plot1_title

Can you copy and paste the output of dput(head(my_regression_df, 10))?

structure(list(artists = c("Gen Hoshino", "Ben Woodward", "Ingrid Michaelson;ZAYN",
"Kina Grannis", "Chord Overstreet", "Tyrone Wells", "A Great Big World;Christina Aguilera",
"Jason Mraz", "Jason Mraz;Colbie Caillat", "Ross Copperman"),
track_name = c("Comedy", "Ghost - Acoustic", "To Begin Again",
"Can't Help Falling In Love", "Hold On", "Days I Will Remember",
"Say Something", "I'm Yours", "Lucky", "Hunger"), popularity = c(73L,
55L, 57L, 71L, 82L, 58L, 74L, 80L, 74L, 56L), duration_ms = c(230666L,
149610L, 210826L, 201933L, 198853L, 214240L, 229400L, 242946L,
189613L, 205594L), danceability = c(0.676, 0.42, 0.438, 0.266,
0.618, 0.688, 0.407, 0.703, 0.625, 0.442), energy = c(0.461,
0.166, 0.359, 0.0596, 0.443, 0.481, 0.147, 0.444, 0.414,
0.632), loudness = c(-6.746, -17.235, -9.734, -18.515, -9.681,
-8.807, -8.822, -9.331, -8.7, -6.77), acousticness = c(0.0322,
0.924, 0.21, 0.905, 0.469, 0.289, 0.857, 0.559, 0.294, 0.426
), liveness = c(0.358, 0.101, 0.117, 0.132, 0.0829, 0.189,
0.0913, 0.0973, 0.151, 0.0735), tempo = c(87.917, 77.489,
76.332, 181.74, 119.949, 98.017, 141.284, 150.96, 130.088,
78.899), track_genre = c("acoustic", "acoustic", "acoustic",
"acoustic", "acoustic", "acoustic", "acoustic", "acoustic",
"acoustic", "acoustic")), row.names = c(NA, 10L), class = "data.frame")

This was the output ^

Maybe you need something like this

# you reprex data is only for acustic in track_genre colum
plot1 <- ggplot(data=my_regression_df, aes(x=popularity, y=danceability)) +
  geom_point() +
  labs(title="popularity vs. danceability", 
       x="popularity index",
       y="danceability index") +
  theme_light() # for better them.

plot1

This topic was automatically closed 21 days after the last reply. New replies are no longer allowed.

If you have a query related to it or one of the replies, start a new topic and refer back with a link.