NBA 18-19 Analytics App & Kobe Bryant Tribute
Authors: Ander Fernandez Jauregui
Working with Shiny <1 year
Abstract: App that enables to: visualize the shooting goal totals and percentage of any player in the field for any shot type, compare two players by their shooting percentages and pays honor to Kobe Bryant.
Shiny app: https://ander-fernandez.shinyapps.io/Basketball-Analytics-App/
Github Repo: GitHub - anderfernandez/Basketball-Analytics-App: Data for NBA Basketball Analytics App
Full Description: This app trys to unlock the visual potential of a Shiny app. To do so, I have work hard with Shiny, CSS and JavaScript.
The app fulfills three main goals:
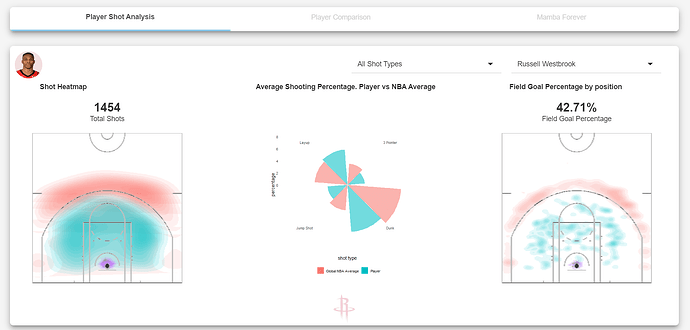
1. Analyze the shooting pattern of any NBA player
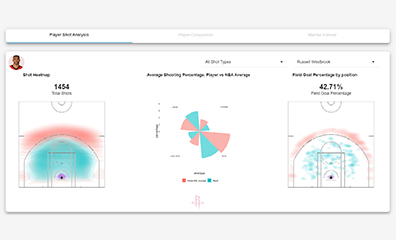
Players tend to shot from many positions, but they usually have higher scoring percentages in some positions. Would be great to know from where a specific player usually shoots and from where does this player have a better scoring percentage?
In this first tab you will be able to analyze exactly that for any player of the 2018-2019 NBA season.
Simply pick a player and the shot type you want to analyze (all shot types is not allowed due to lack of memory of shinyapps free server). The app will automatically do the math and plot two field-heatmaps. By the way, the fields are done with ggplot2 ![]()
Besides, I have created a pollar chart that enables you to compare that exact player with the global scoring average of the nba for that shot type and season.
I have also added the raw numbers (amount of shots thrown and scoring percentage) so that we can have a clear idea of the data.
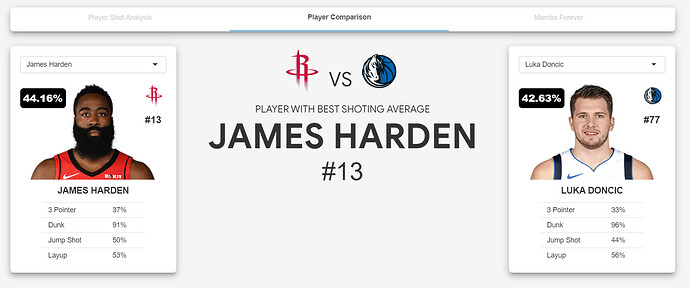
2. Compare the shooting scoring percentage of two players
There are many players on the NBA but, which one is better? In this case, I have created a comparison "game" between players.
The methodology is pretty straightforward: just pick two players. The app will automatically calculate the shooting scoring percentage for both players and compare them.
The winner will be shown in the middle of the app with some confetti animation (this is done with some JavaScript, which you will also find on the repo).
Besides, the app automatically scraps and shows the photo, jersey number and team logo for each player and the winning player.
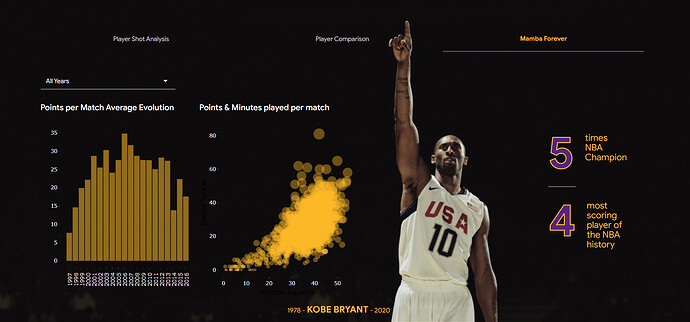
3. Kobe Bryant tribute
Kobe Bryant was a legend and it wouldn't be fair to do an app without honoring him on the app.
To do so, I have shown the average scoring points per game for each of the seasons he played, together with the minutes and scoring data for each match.
I have also worked out the two major accomplishments of Kobe for each year and in general, so you that for each year you choose you will learn what he did.
Finally, I have wanted to make this tab a little bit special. That is why, when you enter here, all the style of the app changes: an image is set as background, colors and styles are changed... I have tryed to make Kobe's tab special as he was for many of us.
--
Final notes.
-The app has a large CSS "developing" behind. It not only imitates material design but it is also responsive. I am not an expert on CSS so probably there are many mistakes and things to improve, but I does the trick.
-All the data I have used is accessible from an API or scraping. You have the script I have used to get all the data in the Github repo.
- I have uploaded the app to RStudio Cloud. The app works locally but not on the cloud due to some problems with plotly.
Category: Sports
Keywords: sports, basketball, visualization, interactive, javascript
Shiny app: https://ander-fernandez.shinyapps.io/Basketball-Analytics-App/
Repo: GitHub - anderfernandez/Basketball-Analytics-App: Data for NBA Basketball Analytics App
RStudio Cloud: Posit Cloud
Thumbnail:
Full image:
