Hey,
I've been given a rather tough request and I have consulted with many people on how to create such function but have struggled to do so.
I'm trying to write a function NB that, for which given a data frame with discrete values and a class,
returns the priors and likelihood function.
I've been told that my answers can be verified for the HairEyeColor dataset by using the Naive Bayes Classifier in R (package e1071)
I understand that this is a rather difficult question, so i am sorry for any inconvenience of your time this may cause!
Thankyou!!
Jennifer
What have you tried so far? Can you post a small reprex with sample data, your code, and what your desired output looks like?
That’s the problem because I’m not sure if where to start at all. Also the HairEycolour dataset is in r studio…I’ve tried to create the function myself but It hasn’t had much luck and is very off topic I’ve been told
@danr is there a chance that you could help with this please?
Jennifer
I've been working on what the output should look like for the past 5 days and have been able to figure out what this function should give me. The sample data is as follows:
> HairEyeColor
, , Sex = Male

       Eye
Hair    Brown Blue Hazel Green
  Black    32   11    10     3
  Brown    53   50    25    15
  Red      10   10     7     7
  Blond     3   30     5     8

, , Sex = Female

       Eye
Hair    Brown Blue Hazel Green
  Black    36    9     5     2
  Brown    66   34    29    14
  Red      16    7     7     7
  Blond     4   64     5     8
When applying the function NB, with the given dataset above, with the discrete values and a class, I wish for the function to return priors and likelihood function
In other words, I wish my NaiveBayes function, for when applied with the dataset above (HairEyeColor) to return the folllowing parameters:
A-priori probabilities:
Sex
Male Female
0.4712838 0.5287162
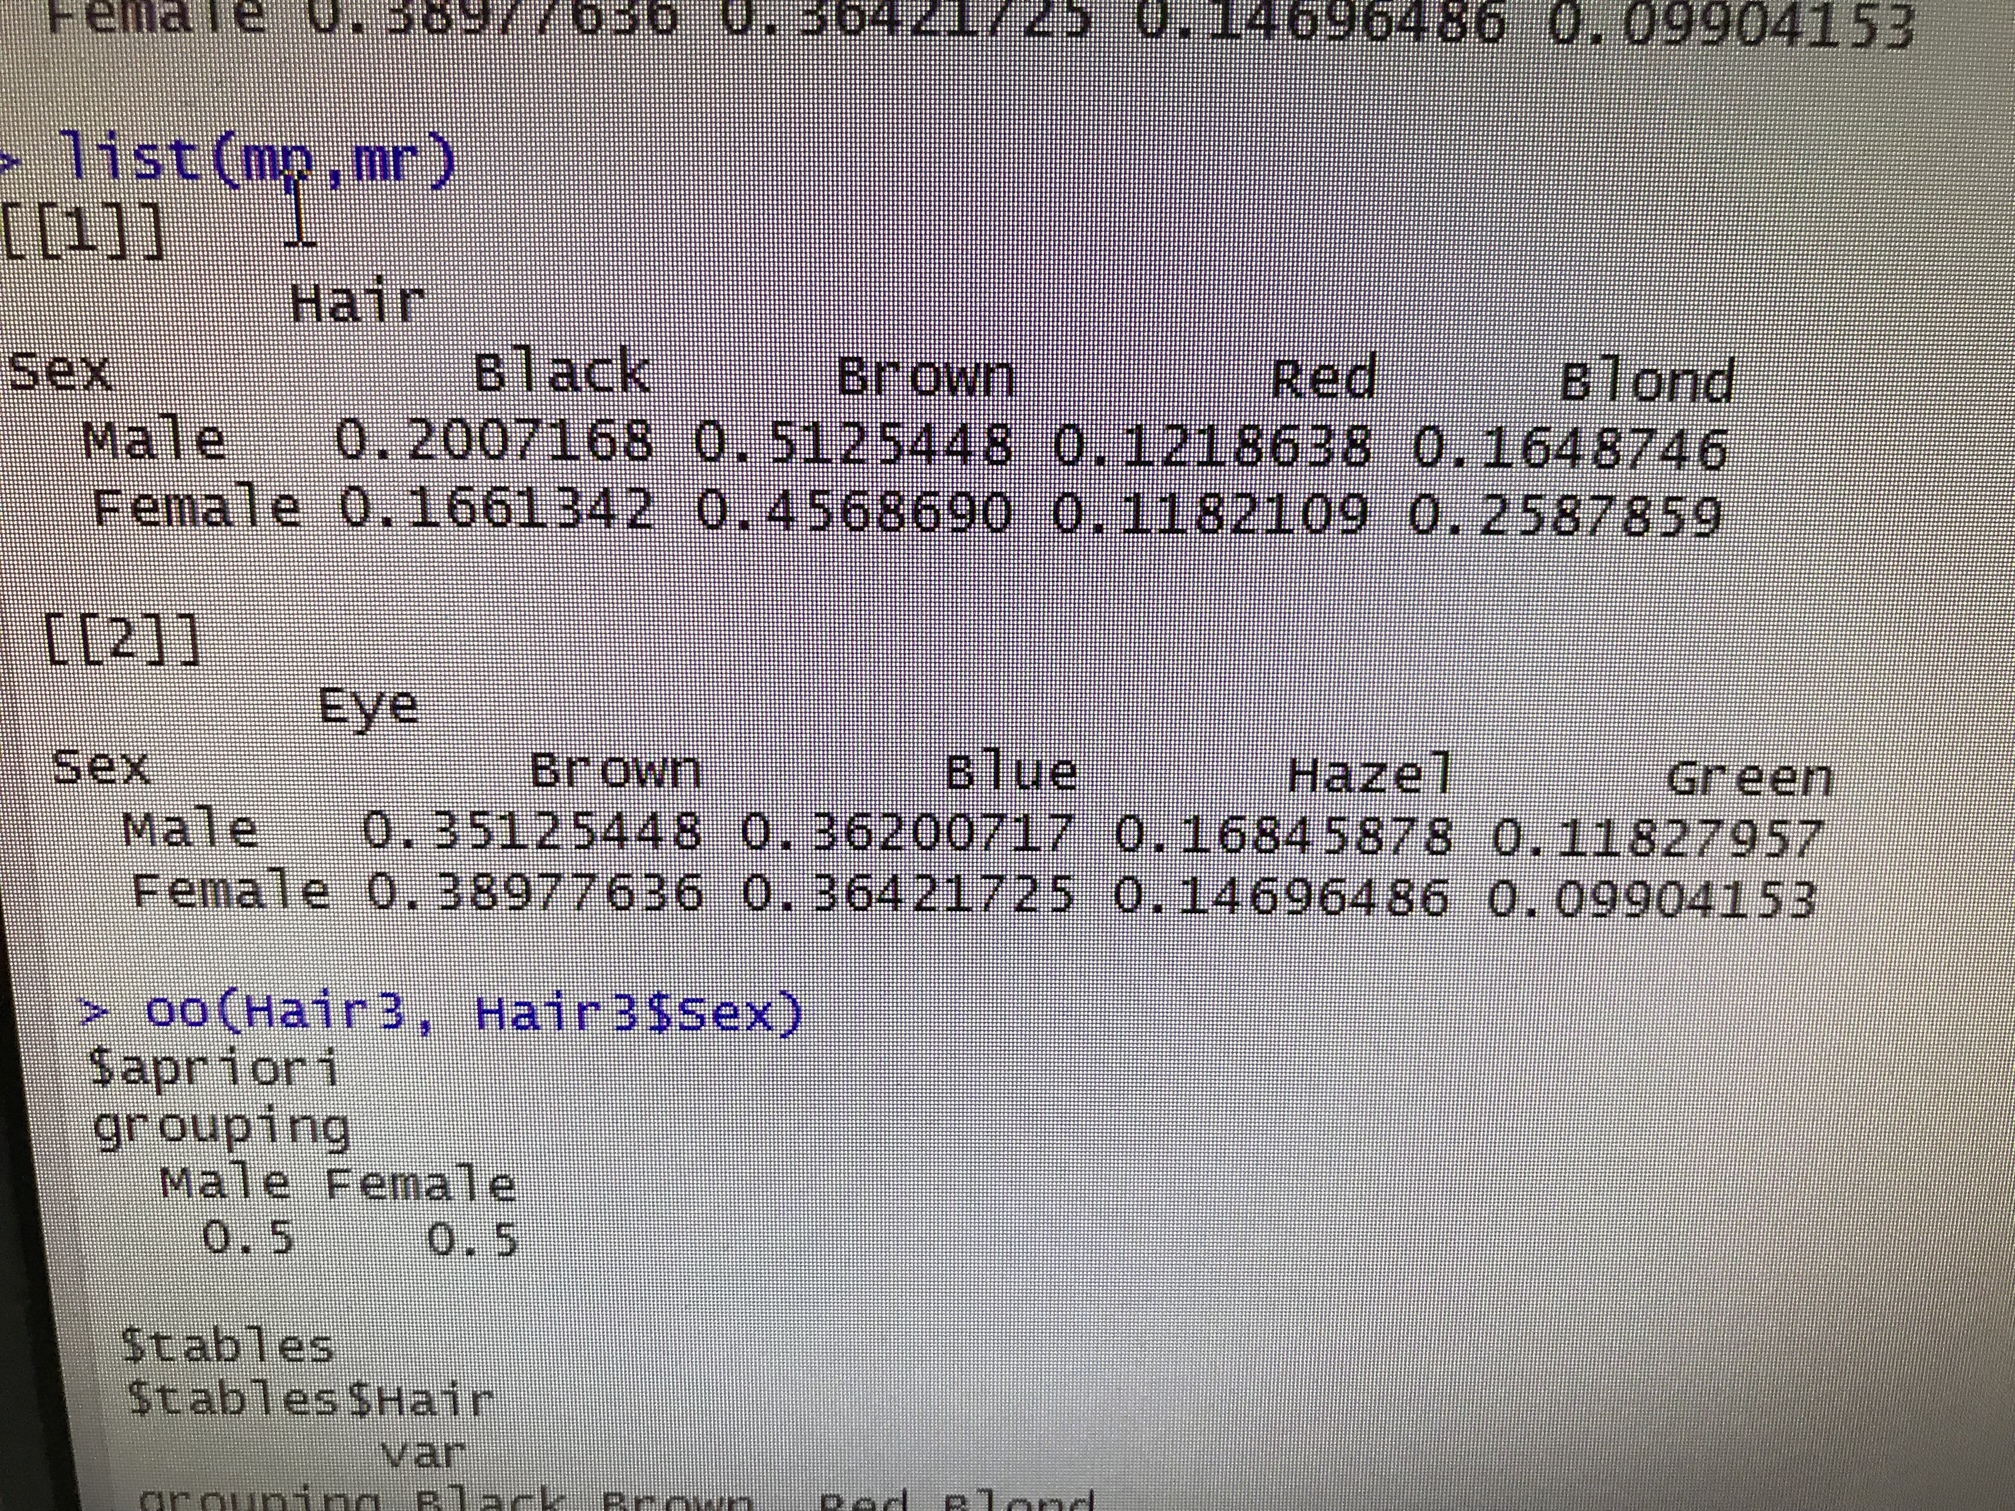
Conditional probabilities:
Hair
Sex Black Brown Red Blond
Male 0.2007168 0.512448 0.1218638 0.1648746
Female 0.1661342 0.456890 0.1182109 0.2587859
Eye
Sex Brown Blue Hazel Green
Male 0.35125448 0.36200717 0.16845878 0.1127957
Female 0.38977636 0.36421725 0.14696486 0.09904153
I was wondering If I could have some help in creating a function which would return the above output from the "HairEyeColor" dataset. I have not had any luck myself since I am struggling where to start with this function
I very much appreciate any help you can give for this
Jennifer
Is your data in the same format as the HairEyeColor data (.i.e. multidimensional tables)?
If not, you might try taking a look under the hood of klaR:::NaiveBayes.default. It is a fairly simple function and does everything that you are looking for. If it doesn't help outright, you could emulate the (base) R code found there. Here is a discrete-predictor only version of that function that would require that the predictors be in the columns of a data frame:
# from klaR:::NaiveBayes.default
foo <- function (x, grouping, prior = NULL,
                 fL = 0, ...){
  x <- data.frame(x)
  if (!is.factor(grouping))
    stop("grouping/classes object must be a factor")
  if (is.null(prior))
    apriori <- table(grouping) / length(grouping)
  else
    apriori <- as.table(prior / sum(prior))
  call <- match.call()
  Yname <- "grouping"
  LaplaceEst <-
    function(x, f = 0)
      t(apply(x, 1, function(u)
        (u + f) / (sum(u) + (length(u) * f))))
  est <- function(var) {
    LaplaceEst(table(grouping, var), f = fL)
  }
  tables <- lapply(x, est)
  names(dimnames(apriori)) <- Yname
    list(
      apriori = apriori,
      tables = tables,
      levels = levels(grouping)
    )
}
> library(recipes)
> data("credit_data")
>
> foo(credit_data[, c("Marital", "Records")], credit_data$Status)
$apriori
grouping
      bad      good
0.2815447 0.7184553

$tables
$tables$Marital
        var
grouping    divorced   married  separated    single      widow
    bad  0.011164274 0.6610845 0.05103668 0.2615630 0.01515152
    good 0.007502344 0.7539856 0.02063145 0.2028759 0.01500469

$tables$Records
        var
grouping        no       yes
    bad  0.6578947 0.3421053
    good 0.8925000 0.1075000


$levels
[1] "bad"  "good"
2 Likes
Many thanks for the code you’ve given, the problem is that in the output I’ve received with the HairEyeColor dataset, I’m receiving the dataset with the conditional probabilities/likelihood being
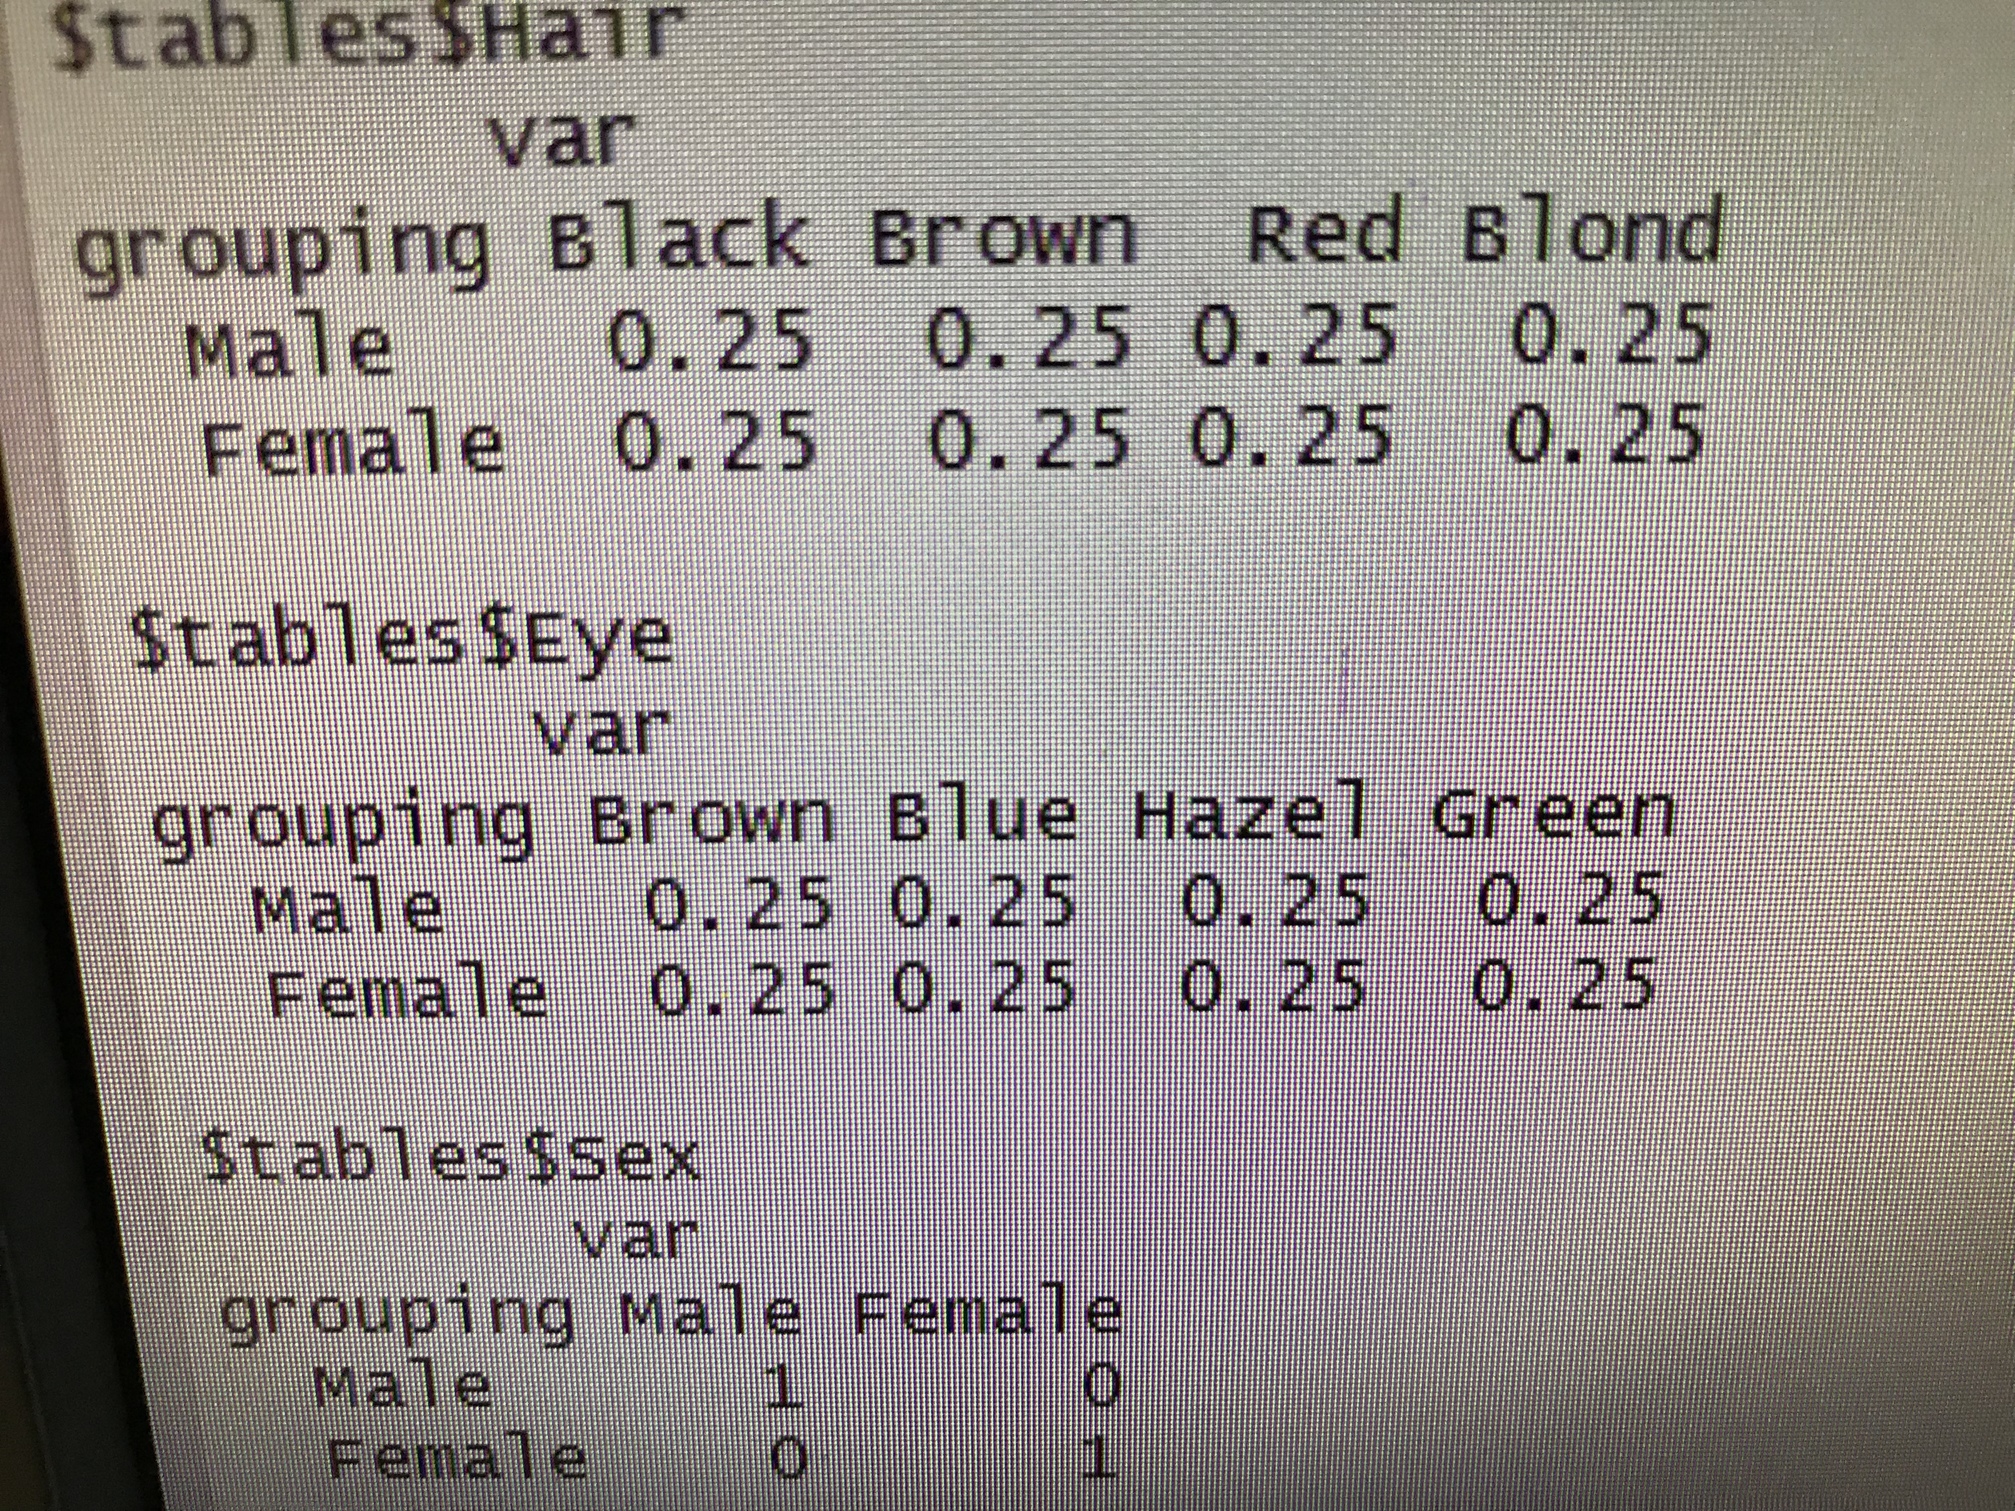
However, the output for the conditional probabilities doesn’t take into account the frequencies for the instances, such that what I should receive is the following (which I shall give in the next post because I can only provide one picture per post since I’m a new user)
Also yes the format is the multidimensional
In that case, here is a tidyr-like function that does the computations (hopefully this isn't someone's homework problem)
tidy_naive_bayes <- function(data, class = "class",  ...) {
  require(rlang)
  require(tidyselect)
  require(purrr)
  require(dplyr)

  data <- as.data.frame(data)
  predictor_vars <- quos(...)
  predictors <- unname(vars_select(names(data), !!! predictor_vars))

  cond_probs <- function(x, dat, y) {
    x <- get_expr(x)

    # Total count across the classes
    y_count <- dat %>%
      group_by(!!y) %>%
      summarize(denom = sum(Freq))

    # Counts by class and predictor, then combine to get probs
    cond_count <- dat %>%
      group_by(!!y, !!x) %>%
      summarize(count = sum(Freq)) %>%
      inner_join(y_count) %>%
      mutate(prob = count/denom) %>%
      ungroup()
  }
  cond_freq_dist <- map(quos(...), cond_probs, dat = data, y = enexpr(class))
  names(cond_freq_dist) <- predictors
  prior_probs <- data %>%
    group_by(!! enexpr(class)) %>%
    summarize(denom = sum(Freq)) %>%
    mutate(prob = denom/sum(data$Freq))

  list(prior = prior_probs,
       conditionals = cond_freq_dist)
}
> tidy_naive_bayes(HairEyeColor, Sex, Hair, Eye)
Joining, by = "Sex"
Joining, by = "Sex"
$prior
# A tibble: 2 x 3
  Sex    denom  prob
  <fct>  <dbl> <dbl>
1 Male     279 0.471
2 Female   313 0.529

$conditionals
$conditionals$Hair
# A tibble: 8 x 5
  Sex    Hair  count denom  prob
  <fct>  <fct> <dbl> <dbl> <dbl>
1 Male   Black  56.0   279 0.201
2 Male   Brown 143     279 0.513
3 Male   Red    34.0   279 0.122
4 Male   Blond  46.0   279 0.165
5 Female Black  52.0   313 0.166
6 Female Brown 143     313 0.457
7 Female Red    37.0   313 0.118
8 Female Blond  81.0   313 0.259

$conditionals$Eye
# A tibble: 8 x 5
  Sex    Eye   count denom   prob
  <fct>  <fct> <dbl> <dbl>  <dbl>
1 Male   Brown  98.0   279 0.351
2 Male   Blue  101     279 0.362
3 Male   Hazel  47.0   279 0.168
4 Male   Green  33.0   279 0.118
5 Female Brown 122     313 0.390
6 Female Blue  114     313 0.364
7 Female Hazel  46.0   313 0.147
8 Female Green  31.0   313 0.0990
1 Like
That’s excellent, this is exactly what I required. I’m trying not to use libraries though, Is there anyway around this?
And this isn’t a homework question, it’s a problem I’m having at work, I’m just using the HairEyeColor dataset as an exemplar dataset
Just for future reference, please try to give any such constraints early on (and apologies if you did so and I missed it) so that responders know. Thx. ![]()
I’m trying not to use libraries though
It would be difficult to write a function for your problem/data structure without using some package. The best solution would be the original if you don't want to use packages (unless you are okay with for loops and hardcoded variable names) and you can reformat the data.
Here's an example of why that would be difficult. With HairEyeColor, there is no easy way to specify which dimension of this 3D table is the outcome and which are the predictors without a formula interface or the tidy approach above. There are ways to do it (Hmisc has code that is similar) but you would probably end up rewriting a bunch of infrastructure just to avoid having package dependencies.