trl.la
October 13, 2020, 6:00pm
1
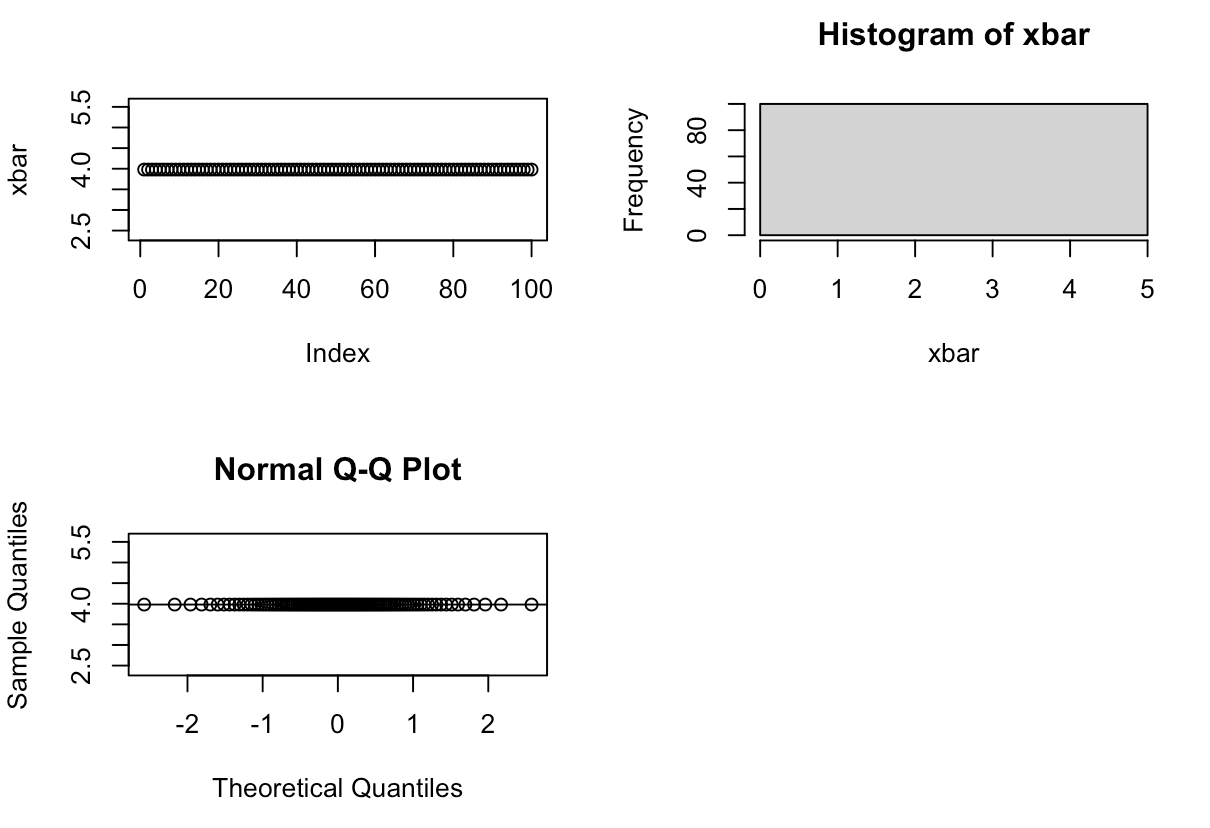
Hello,
This is my code and graphs
xbar = {}
par(mfrow = c(2,2))
trl.la
October 13, 2020, 6:01pm
2
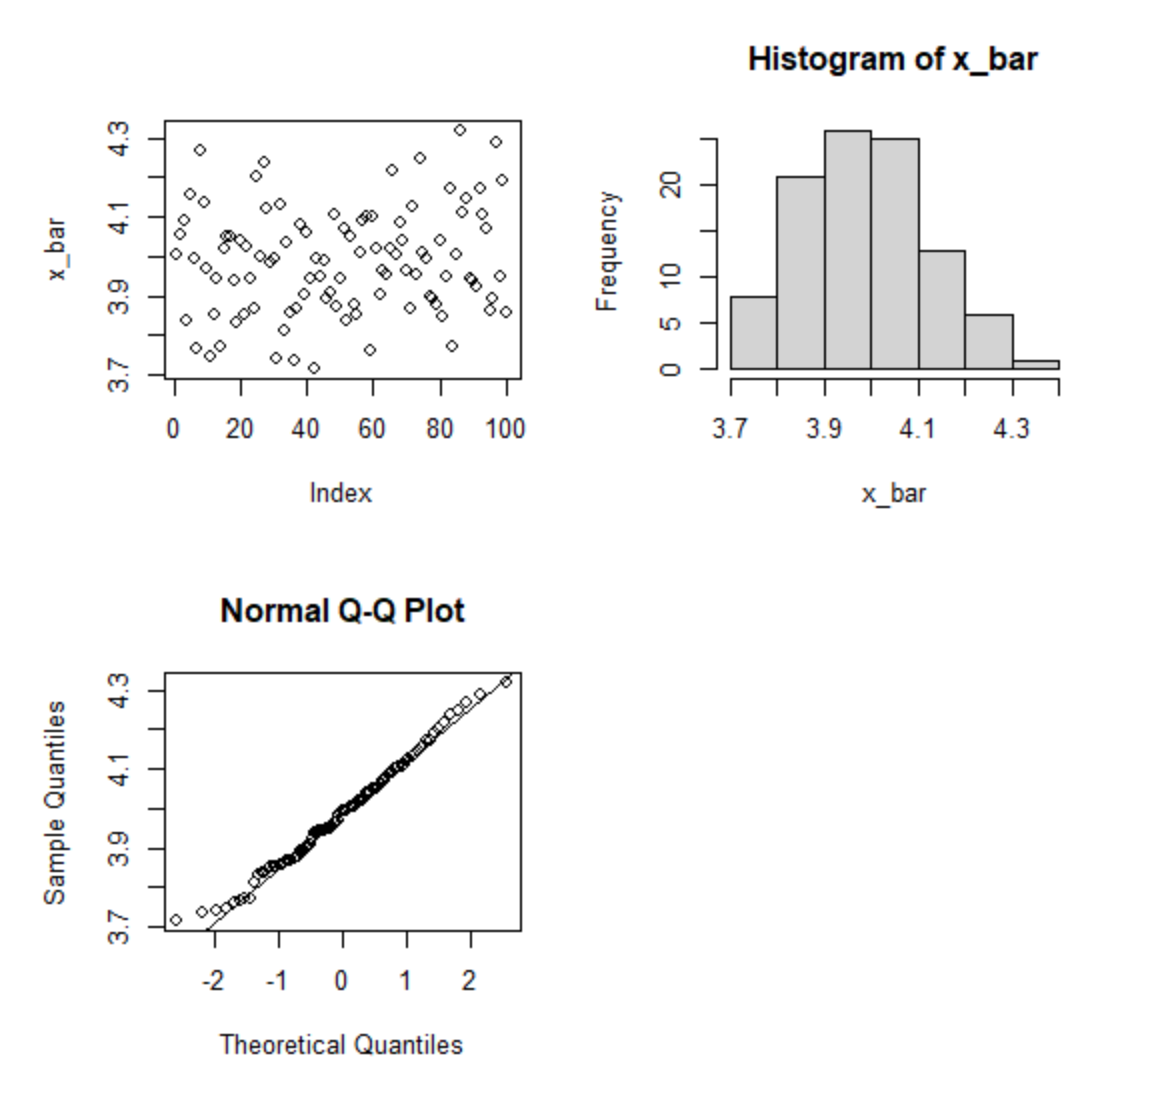
This is what the graphs are supposed to look like
jms
October 13, 2020, 6:34pm
3
Hi,xbar before plotting it. The problem lies within the method you are using to produce your data.
trl.la
October 13, 2020, 7:36pm
4
Thank you so much! I found out what I did wrong with the xbar
system
October 20, 2020, 7:36pm
5
This topic was automatically closed 7 days after the last reply. New replies are no longer allowed.