Multiple X axis labels

Hi everyone

I want to draw a boxplot with three x-axis label levels. I have a dataframe named mydata likes following (8 Culvivars, 2 species, 2 origin levels,)
Cultivar Species Origin Treatment Growth
M DS Me CT 23
M DS Me TM 13
N DS Me CT 32
N DS Me TM 32
B DS Col CT 12
B DS Col TM 21
R DS Col CT 21
R DS Col TM 23
E CF Me CT 23
E CF Me TM 31
L CF Me CT 21
L CF Me TM 21
H CF Col CT 12
H CF Col TM 24
D CF Col CT 34
D CF Col TM 22

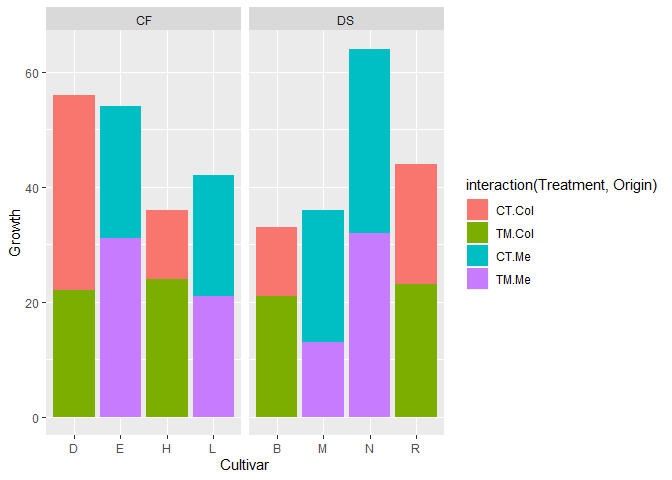
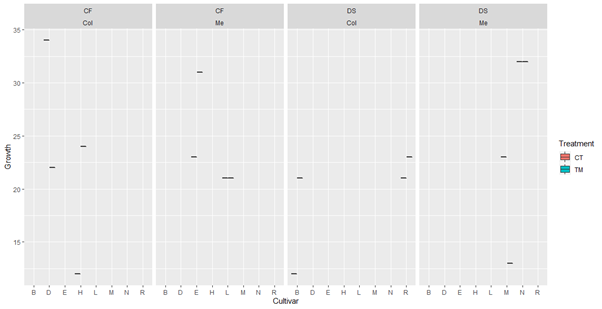
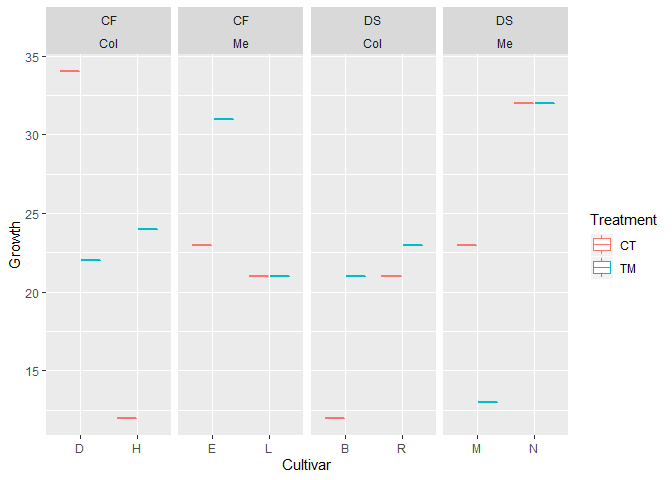
I want to create a bar chart with y axis is height, x axis presents three levels includes Species, Origin and Cultivar (group by Species and then origin)
I have tried with command:
ggplot(mydata, aes(x=Cultivar, y=Growth, fill=Treatment) + geom_boxplot() + facet_wrap(~Species, scales="free_x")
By doing this, I could draw a boxplot grouped by species. However, I have no idea how to split by Origin.
Your idea is really appreciated!

Thank you very much!
Kind regards,

I am not sure you just what you want. You mention both box plots and bar charts. Here is one way to include Origin in the plot.

library(ggplot2)
DF <- read.csv("c:/users/fjcc/Documents/R/Play/Dummy.csv", sep = " ")
ggplot(DF, aes(x=Cultivar, y=Growth, fill=interaction(Treatment,Origin))) + 
         geom_col() + facet_wrap(~Species, scales="free_x")

Created on 2020-02-19 by the reprex package (v0.3.0)

Hi FJCC,

Thank you very much for contributing and also sorry for making confusion.
Yeap, I just want to make a boxplot (sorry again for making above mistake)
I have tried another way and it created a plot that I nearly want but still have to think more to get the right one.
My command: ggplot(mydata, eas(x=Cultivar, y=Growth, fill= Treatment)) + geom_boxplot() + facet_wrap(Species~Origin, ncol=4)
By informing this, it built a plot which was split following Species and Origin. However, in X axis it did not separate by Cultivar.
image

Thank you again!
Regards,

Like this? Notice I used color instead of fill because the box plots are only lines.

library(ggplot2)
DF <- read.csv("c:/users/fjcc/Documents/R/Play/Dummy.csv", sep = " ")
ggplot(DF, aes(x=Cultivar, y=Growth, color= Treatment)) + geom_boxplot() + 
  facet_wrap(Species~Origin, ncol=4, scales = "free_x")

Created on 2020-02-19 by the reprex package (v0.3.0)

Yeap, I got it. It worked for me.
It's really helpful.
Thank you very much FJCC!

Regards,
Mui

This topic was automatically closed 21 days after the last reply. New replies are no longer allowed.