Multiple values for one column

Dear R Studio,

I have a movies dataset, with a "vote_average" and a "genres" column. The genre column contains multiple genres for every movie; however, the number of genres to which every movie belongs are different (e.g. two, three, four etc.)

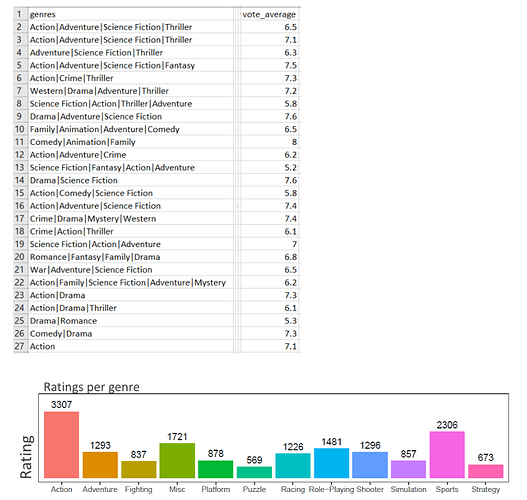
I want to see if certain genres lead to higher ratings, and to create a boxplot similar to the one below:

My trouble is that I don't know how to split the values from the "genres" column, and how to create the boxplot, considering that some rows have two genres, others three, and others even more.

Some help and guidance would be very, very much appreciated.

Thank you.

*Later edit:

homework

You can use tidyr::separate_rows() see this example

library(tidyverse)

sample_data <- data.frame(stringsAsFactors = FALSE,
                          genres = c("Action|Adventure|Science Fiction|Thriller", "Action|Crime|Thriller"),
                          vote_average = c(6.5, 7.1))

sample_data %>% 
    separate_rows(genres)
#>      genres vote_average
#> 1    Action          6.5
#> 2 Adventure          6.5
#> 3   Science          6.5
#> 4   Fiction          6.5
#> 5  Thriller          6.5
#> 6    Action          7.1
#> 7     Crime          7.1
#> 8  Thriller          7.1

Created on 2019-12-29 by the reprex package (v0.3.0.9000)

If you need more specific help, please provide a proper REPRoducible EXample (reprex) illustrating your issue.

6 Likes

Hi @anon12605616 and welcome to RStudio Community.

What you are trying to achieve is actually very possible to do in R; however, I am not very sure about what value the barchart represents. The title of the chart is "Ratings per genre", but the values are in the hundreds and the thousands. Are these counts (how many times the genre showed up in the dataset)? Or something else?

In any case, I would also like to suggest that we, in the RStudio Community, are more than happy to provide our help. But we need you to help us too. For example, it would have been great if you provided your dataset, this way all potential helpers would just have to write code and send it to you. You posted a picture, which helps to know what the data look like; however, it cannot really be sliced and diced. I hope you understand what I mean.

I simulated a dataset for you:

library(dplyr)
library(purrr)

set.seed(123)

genres <- c("Action", "Adventure", "Science Fiction", "Thriller", "Western", "Drama", "Crime", "Comedy")

movie_data <- tibble(
  genres = map_chr(sample(5, 50, replace = TRUE), function(x){
    sample(genres, size = x, replace = FALSE) %>%
      paste(collapse = "|")
  }),
  vote_average = runif(length(genres), 0, 10)
)

movie_data

# A tibble: 50 x 2
   genres                                vote_average
   <chr>                                        <dbl>
 1 Crime|Action|Adventure                        5.31
 2 Thriller|Crime|Comedy                         7.85
 3 Drama|Comedy                                  1.68
 4 Science Fiction|Drama                         4.04
 5 Drama|Crime|Action                            4.72
 6 Drama|Adventure|Action|Crime|Thriller         8.68
 7 Western|Comedy|Drama|Science Fiction          9.26
 8 Action                                        8.82
 9 Thriller|Drama                                6.74
10 Action|Drama|Comedy                           9.50
# … with 40 more rows

The function you are looking for is the separate_rows() function from the {tidyr} package. It does all the work for you.

library(tidyr)

movie_data_separated <- movie_data %>%
  separate_rows(genres, sep = "\\|")

# A tibble: 145 x 2
   genres          vote_average
   <chr>                  <dbl>
 1 Crime                   5.31
 2 Action                  5.31
 3 Adventure               5.31
 4 Thriller                7.85
 5 Crime                   7.85
 6 Comedy                  7.85
 7 Drama                   1.68
 8 Comedy                  1.68
 9 Science Fiction         4.04
10 Drama                   4.04
# … with 135 more rows

The final transformation step is to group_by() genres and then aggregate the vote averages in a way you see fit (hence my question earlier). Here, I just compute the average:

movie_data_by_genre <- movie_data_separated %>%
  group_by(genres) %>%
  summarize(vote_average = mean(vote_average, na.rm = TRUE))

movie_data_by_genre

# A tibble: 8 x 2
  genres          vote_average
  <chr>                  <dbl>
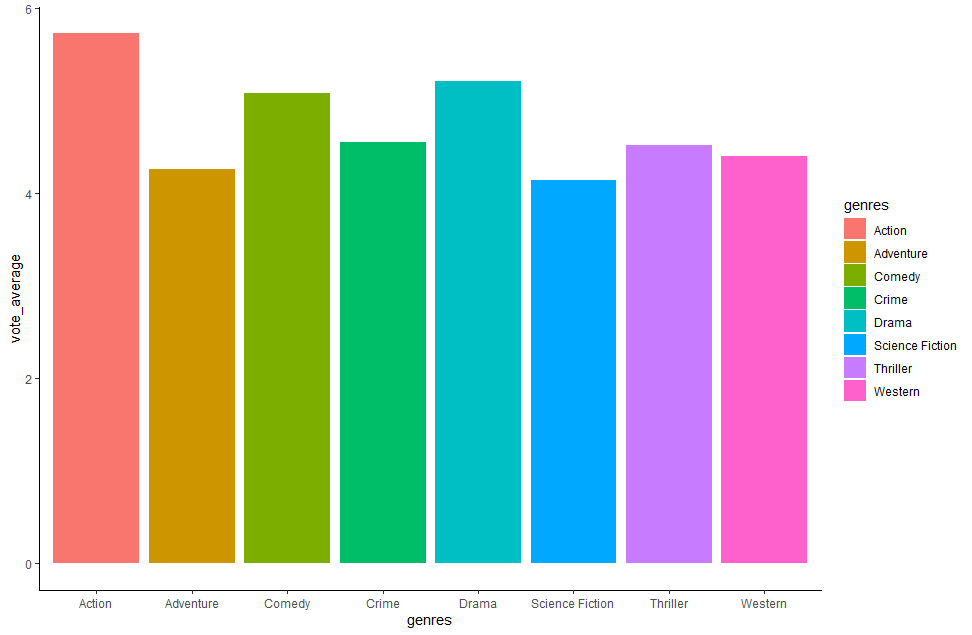
1 Action                  5.73
2 Adventure               4.26
3 Comedy                  5.08
4 Crime                   4.56
5 Drama                   5.21
6 Science Fiction         4.15
7 Thriller                4.53
8 Western                 4.40

The data is now in good shape for visualization with a bar chart:

library(ggplot2)

ggplot(data = movie_data_by_genre, aes(x = genres, y = vote_average)) +
  geom_col(aes(fill = genres)) +
  theme_classic()
Here, I give you the full code that you need:

library(dplyr)
library(purrr)
library(tidyr)
library(ggplot2)

set.seed(123)

genres <- c("Action", "Adventure", "Science Fiction", "Thriller", "Western", "Drama", "Crime", "Comedy")

movie_data <- tibble(
  genres = map_chr(sample(5, 50, replace = TRUE), function(x){
    sample(genres, size = x, replace = FALSE) %>%
      paste(collapse = "|")
  }),
  vote_average = runif(length(genres), 0, 10)
)

movie_data

movie_data_by_genre <- movie_data %>%
  separate_rows(genres, sep = "\\|") %>%
  group_by(genres) %>%
  summarize(vote_average = mean(vote_average, na.rm = TRUE))

ggplot(data = movie_data_by_genre, aes(x = genres, y = vote_average)) +
  geom_col(aes(fill = genres)) +
  theme_classic()
4 Likes

Hi, and welcome!

@andresrcs and @gueyenono's examples of a reproducible example, called a reprex will get you started on the second part of your question, producing a boxplot from data similar to yours disaggregated into genres with some measure (he used average) of ratings.

The first part, how to disaggregate the first column is more interesting. A year ago, I worked on the movielens dataset, and I've uploaded a small, grouped by genres subset of fifty records with the same genres field and the ratings expressed as the number of ratings received for the combination of genres. The data can be loaded with

movies <- read_csv("https://gist.githubusercontent.com/technocrat/b5a78af6c174eb983b95a19659b83a33/raw/ab0664b1ac314902b2e130aae43e9f71214de43f/movielens.csv")

Now, to clarify the question: Are you interested in grouping by combinations of genres "Action | Drama | War" or by each genre (which means greater weight to the ratings of multiply classified movies)? When I did my analysis, I settled on the first genre, but that was only one of many choices I could have made.

Finally, how many records will you be working with, is your data derived from movielens and is this homework (in which case see, homework policy).

2 Likes

Thank you very much, despite me not writing my question accordingly. I wasn't aware I am not doing it properly, and I really appreciate your kind feedback and help. Will definitely follow the guidelines for any future topic.

1 Like

Hi @gueyenono, thank you very much for the kind feedback and help. Please excuse the not properly written question, and the extra work it required from you in order to help me, I would have avoided this if I would have realized I was not doing it properly. I understand what you mean, and it completely makes sense.

The barchart is built on a different dataset, I overwrote the title. Although I didn't think as far as to provide a properly written dataset, I did try to make my question as clear as I could, so I uploaded the picture as a reference for what I wanted to do with my question.

I am just learning how to use R and sometimes I am finding the code quite confusing, especially because people have different styles. Your answer is more than I could have hoped for, because even I can understand every step I need to do.

Thank you very much again, and I really appreciate you taking your time to help.

Kind regards.

No problem at all. We are always happy to help people in need. Also, regarding your confusion about the coding styles, don't worry about it too much for now. Just keep learning and the difference between the coding styles will be made clear with time and experience. Happy learning!

2 Likes

Hi @technocrat, your question is very good, because I was also thinking on how to establish what genre I want to use. I would go with each genre, and a final vote average.

Regarding the weights, I don't think I can do much to control them, because I wouldn't know to what extent a movie is "crime", and to what extent "action" and "adventure", in order to split the average accordingly within the movie. So I would say the safest would be to keep for each genre the entire average of the movie. What will do happen, I think, is to have more occurrences of certain genres, but if I use a final genre average for my final comparison, I would assume I could have a representative comparison (for e.g. a movie that is "crime", "action" and "adventure" might bring more insight if keeping all genres, when compared to a movie that only belongs to "crime"). But this is what I am thinking now, maybe tomorrow I will see things differently, as I am yet to early in my data analysis learning phase to truly know what my data can bring. But obviously, I am not 100% sure what would be the best approach, so I am trying to understand what the limitations are in each case and what my analysis would bring in each situation. Your feedback is very helpful for making me rethink this.

I am just learning to work with R, and indeed this is part of a homework. Thank you for sharing the policy, I am learning more than just how to write a code in R from this question that I posted, and I truly appreciate your kind feedback.

For the homework I am supposed to come up with a dataset of my choice, and formulate my own questions. The one I am planning to use is the Movie Dataset from Shariq Shaikh, from kaggle. It has quite a lot of records..

I now realize I could have mentioned that as well in my original question. I didn't think about lots of details.

Again, thank you for the kind help and feedback.

Kind regards.

1 Like

Part of learning R @anon12605616 is just this process of coming up with the right question. It's actually the hardest part!

You're right that imputing a single genre is beyond the scope of your exercise. I can imagine doing machine learning using techniques such as K nearest neighbor or K means clustering, but let's not try that.

I'm going to continue to assume that you want the number (or percentage) of ratings for movies that contain Action, movies with Drama with or without other genres, etc. That variable is going to be the y-axis of your plot. If you want the average rating of such movies, you'll need to decide if you want the average rating of movies containing Action or another genre or some weighted average -- among all movies the average of ratings of each genre weighted by the proportion of movies containing that genre.

I'll focus on the peskier problem: Deconstructing the genres column.

The first step is to identify all the different genres. For my toy database:

suppressPackageStartupMessages(library(readr)) 
suppressPackageStartupMessages(library(stringr)) 
movies <- read_csv("https://gist.githubusercontent.com/technocrat/b5a78af6c174eb983b95a19659b83a33/raw/ab0664b1ac314902b2e130aae43e9f71214de43f/movielens.csv")
#> Parsed with column specification:
#> cols(
#>   genres = col_character(),
#>   ratings = col_double()
#> )
genre_list <- sort(unique(unlist(str_split(movies$genres, "[|]"))))
genre_list
#>  [1] "Action"    "Adventure" "Animation" "Children"  "Comedy"    "Crime"    
#>  [7] "Drama"     "Fantasy"   "Film-Noir" "Horror"    "Musical"   "Mystery"  
#> [13] "Romance"   "Sci-Fi"    "Thriller"  "War"       "Western"

Created on 2019-12-29 by the reprex package (v0.3.0)

Take a look at this from the inside-out, looking at the arguments enclosed by the innermost pair of (), then the functions, such as str_split to understand what the heck "[|]" means. See if you understand why unlist was needed.

This shows that we can split the genres column for one purpose. While I work on an implementation of my idea of how this can be exploited, think about a partial solution. How would you test for the presence of Action in a row? How would you want to record the result?

1 Like

This topic was automatically closed 21 days after the last reply. New replies are no longer allowed.