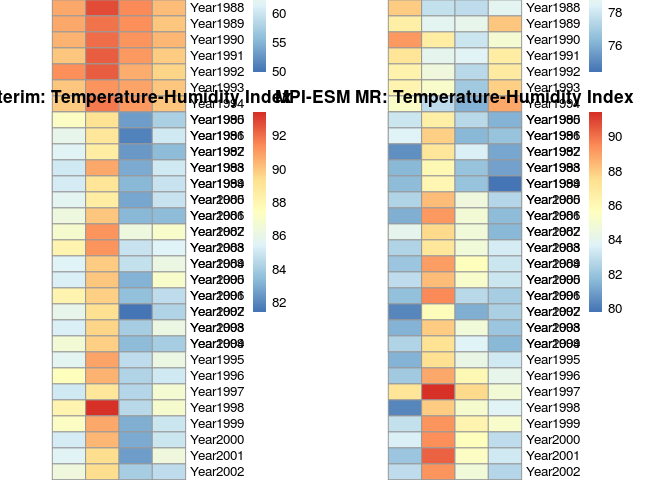
I have a problem plotting these on the same page. I used the "pheatmap" function to generate four heatmaps and want to place them side-by-side. I used the grid. arrange function to generate the map but did not work. Any help will greatly appreciated
##Era-interim
THIera <- read.csv("F:/DISSERTATION FOLDER/Grids/mydata/HI_DI/era/THI/era_seasTHI.csv", row.names = 1)

THI_interim <- pheatmap(THIera, cluster_rows = FALSE, cluster_cols = FALSE,fontsize = 10, main = "Era-interim: Temperature-Humidity Index",
       display_numbers = FALSE, cellwidth = 25,cellheight = 12, angle_col = "45")


## GFDL-ESM2M
THIgfd <- read.csv("F:/DISSERTATION FOLDER/Grids/mydata/HI_DI/gfd_ref/THI/gfd_seasTHI.csv", row.names = 1)

THI_gfdl <- pheatmap(THIgfd, cluster_rows = FALSE, cluster_cols = FALSE,fontsize = 10, main = "GFDL-ESM2M: Temperature-Humidity Index",
         display_numbers = FALSE, cellwidth = 25,cellheight = 12, angle_col = "45")

## HadGEM2-ES
THIhad <- read.csv("F:/DISSERTATION FOLDER/Grids/mydata/HI_DI/had_ref/THI/had_seasTHI.csv", row.names = 1)

THI_hadgem <- pheatmap(THIhad, cluster_rows = FALSE, cluster_cols = FALSE,fontsize = 10, main = "HadGEM2-ES: Temperature-Humidity Index",
        display_numbers = FALSE, cellwidth = 25,cellheight = 12, angle_col = "45")


## MPI-ESM MR
THImpi <- read.csv("F:/DISSERTATION FOLDER/Grids/mydata/HI_DI/mpi_ref/THI/mpi_seasTHI.csv", row.names = 1)

THI_mpiesm <- pheatmap(THImpi, cluster_rows = FALSE, cluster_cols = FALSE,fontsize = 10, main = "MPI-ESM MR: Temperature-Humidity Index",
         display_numbers = FALSE, cellwidth = 25,cellheight = 12, angle_col = "45")


grid.arrange(THI_interim,THI_gfdl,THI_hadgem, THI_mpiesm, ncol=2)


<sup>Created on 2019-08-24 by the [reprex package](https://reprex.tidyverse.org) (v0.2.1)</sup>