Hi all,
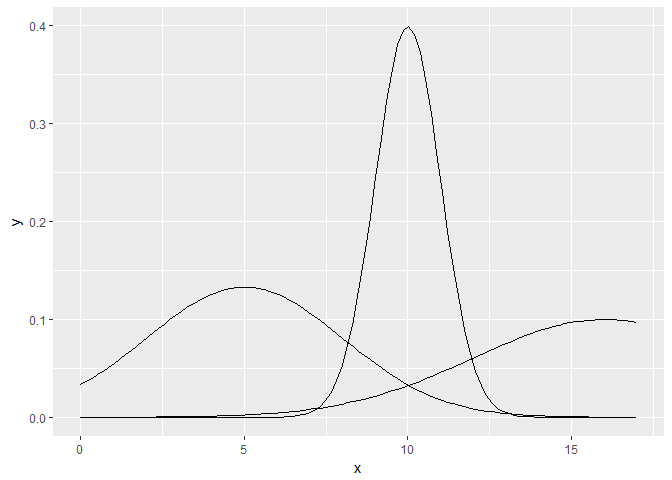
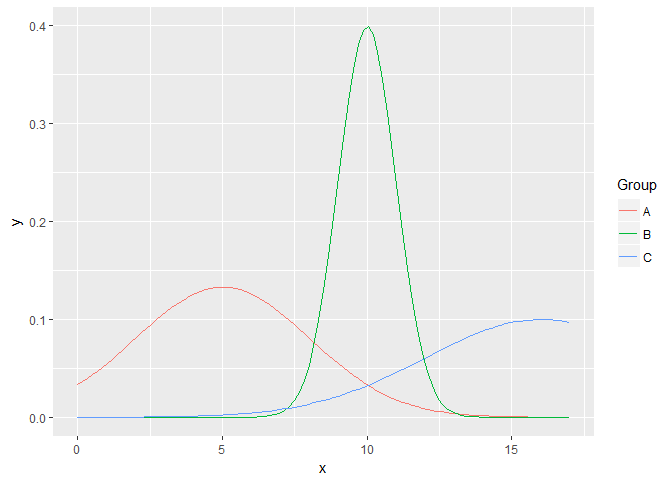
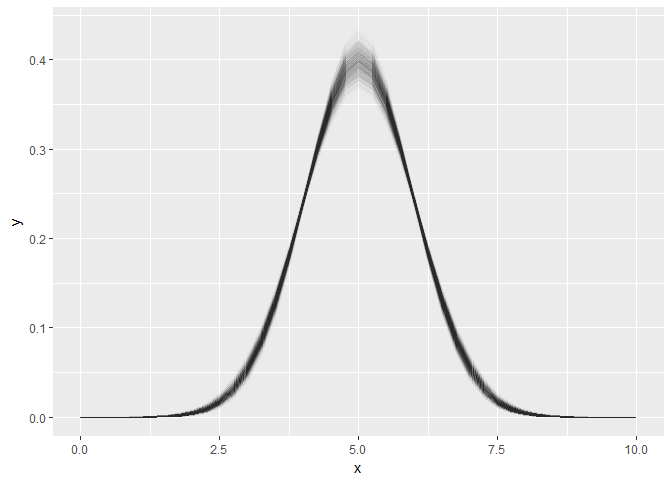
I am trying to plot a number of non-linear curves in ggplot (it's actually loglogistic, but I can't imagine that would make a difference). I have a function loglogistic_fn(x, omega, theta). I have a data frame (called df1) with many different omega and theta possibilities, and I want to show each of them on 1 graph.
If I had was just trying to plot one version, and stored the variables as omega0 and theta0, I could plot it as
ggplot(data = tibble(x = 0:17), aes(x)) +
  stat_function(fun = loglogistic_fn, args = list(omega = omega1, theta = theta1))
If I was just adding in one or two other curves, I could just copy/paste the second line, changing the arguments of omega and theta, but I have too many to do it manually. Is there an automatic way to do it in ggplot? I tried doing
ggplot(data = tibble(x = 0:17), aes(x)) +
  stat_function(fun = loglogistic_fn, args = list(omega = df$omega, theta = df$theta))
but that did not work.
Thanks for your help,
Alan


