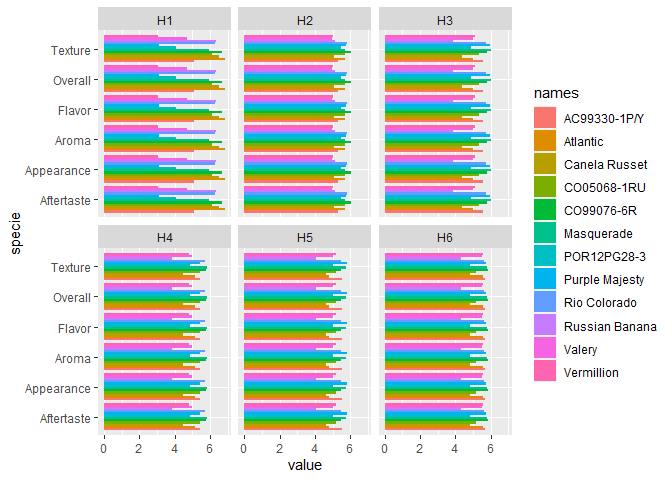
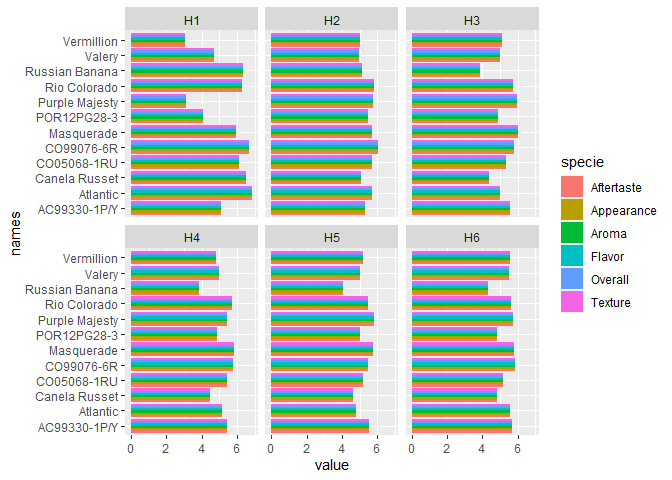
How i can have multiple barplots in one fig (example attached).
Also, i saw code from other forum for multiple barplots, but no idea how to customize it for my data. Code is here:
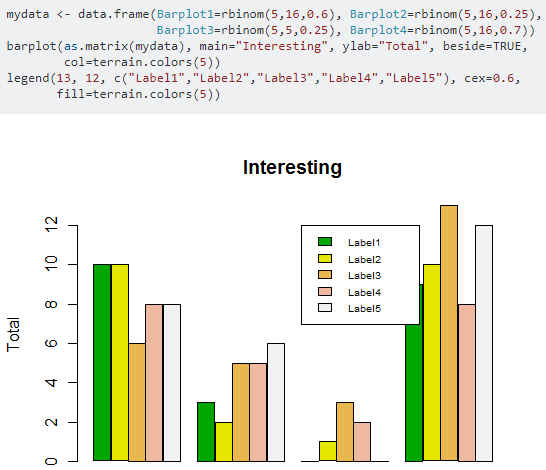
My data code is here:
library(ggplot2)
library(viridis)
library(hrbrthemes)
H1 <- c(6.36, 3.03, 6.85, 4.07, 4.69, 6.27, 6.67, 3.11, 5.07, 6.14, 5.93, 6.49)
H2 <- c(5.15, 5.00, 5.71, 5.50, 4.99, 5.81, 6.05, 5.76, 5.28, 5.69, 5.69, 5.06)
H3 <- c(3.85, 5.13, 4.99, 4.91, 5.01, 5.73, 5.77, 5.94, 5.57, 5.35, 6.00, 4.39)
H4 <- c(3.84, 4.80, 5.15, 4.85, 4.99, 5.73, 5.77, 5.45, 5.44, 5.41, 5.81, 4.46)
H5 <- c(4.08, 5.17, 4.77, 5.03, 5.00, 5.49, 5.49, 5.80, 5.51, 5.18, 5.76, 4.60)
H6 <- c(4.35, 5.59, 5.59, 4.83, 5.52, 5.63, 5.85, 5.74, 5.66, 5.19, 5.79, 4.84)
names <- c("Russian Banana", "Vermillion", "Atlantic", "POR12PG28-3",
"Valery", "Rio Colorado", "CO99076-6R", "Purple Majesty",
"AC99330-1P/Y", "CO05068-1RU", "Masquerade", "Canela Russet")
specie <- c(rep("Appearance", 12), rep("Aroma" , 12), rep("Flavor" , 12),
rep("Overall" , 12), rep("Aftertaste", 12), rep("Texture", 12))
condition <- rep(c("Russian Banana", "Vermillion", "Atlantic", "POR12PG28-3",
"Valery", "Rio Colorado", "CO99076-6R", "Purple Majesty",
"AC99330-1P/Y", "CO05068-1RU", "Masquerade", "Canela Russet") , 6)