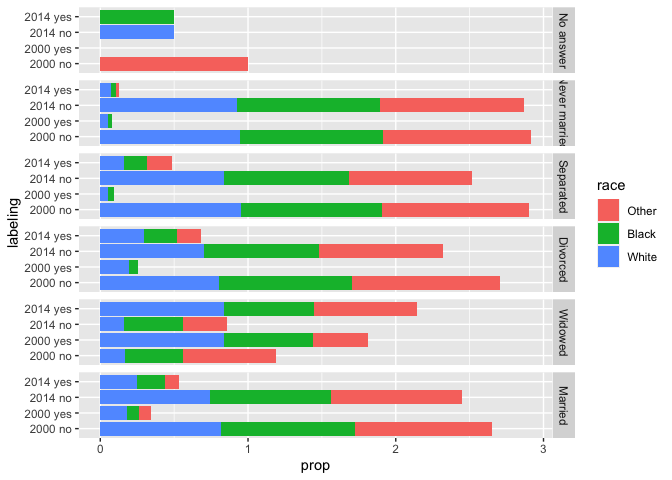
I am trying to make a pretty custom plot, and am having trouble wrapping my head around how best to do it. Essentially, I want to have a barchart that is both stacked and dodged. From stackoverflow 1, stackoverflow 2, it seems like the way to do it is sort of manual, by creating a new variable that is the thing you want "dodged" so that you don't have to have ggplot2 dodge for you.
This mostly works, but it is frustrating me because of the way my labels get repetitive. Here's a reprex using data that doesn't really make sense, but shows the idea:
library(tidyverse)
data("gss_cat")
gss_summarize <- gss_cat %>%
  mutate(retiree = if_else(age>62, "yes", "no")) %>%
  filter(year %in% c(2000, 2014)) %>%
  mutate(year = as_factor(year)) %>%
  group_by(year, marital, race, retiree) %>%
  summarize(n = n()) %>%
  mutate(prop = n/sum(n)) %>%
  mutate(labeling = paste(year, retiree)) %>%
  drop_na()
#> `summarise()` has grouped output by 'year', 'marital', 'race'. You can override
#> using the `.groups` argument.


ggplot(gss_summarize, aes(x=labeling, y=prop, fill = race)) +
  geom_col() +
  facet_grid(rows = vars(marital)) +
  coord_flip()

Created on 2022-08-23 by the reprex package (v2.0.1)
I would like to be able to have two sets of axis labels there-- one set that has 2014/2000 pulled out to the left for each group, and the other that has the yes/no. Sort of like this:

I've found some examples on stackoverflow that show similar ideas for numeric or date scales, but nothing for discrete scales. Any ideas? Should I make this into a numeric scale with discrete labels over the top? Give up on this stack/dodge idea? I really want both the yes/no and 2014/2000 groupings within the same facet (to make it easier to compare them), otherwise doing more of a facet_grid() would make sense.