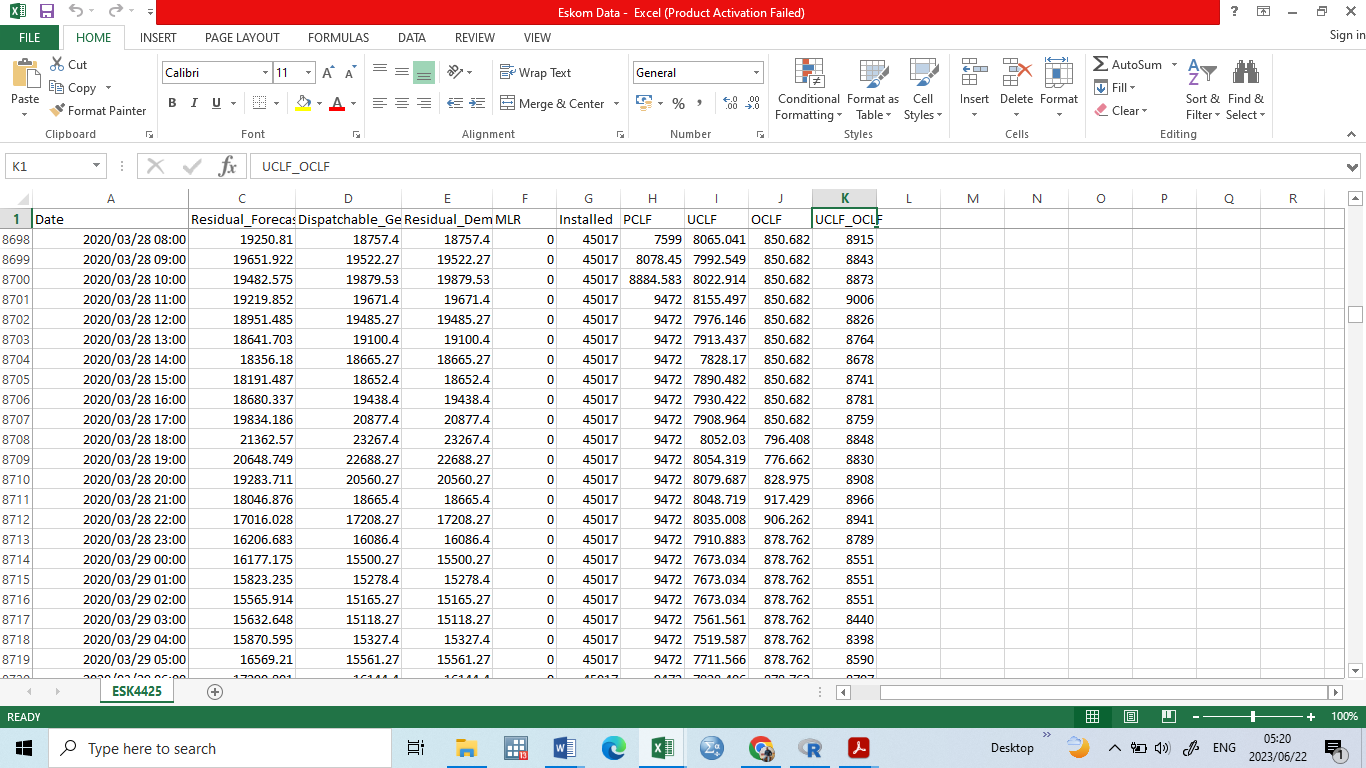
Date Original_Forecast Residual_Foreca~ Dispatchable_Ge~ Residual_Demand
1 2019-04-01 NA 20127. 21035. 21035.
2 2019-04-01 NA 19822. 20548. 20548.
3 2019-04-01 NA 19726. 20413. 20413.
4 2019-04-01 NA 19939. 20476. 20476.
5 2019-04-01 NA 20794. 21156. 21156.
6 2019-04-01 NA 22703. 23079. 23079.
... with 8 more variables: MLR , Installed , PCLF ,
UCLF , OCLF , UCLF_OCLF , Month , Year
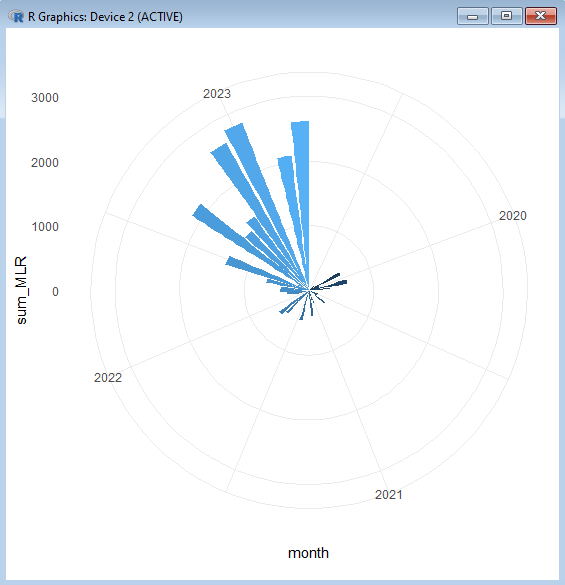
I have the data above from 2019 to 2013, i want to determine the overall monthly mean, to check seasonality. It is load reduction data recorded per hour,