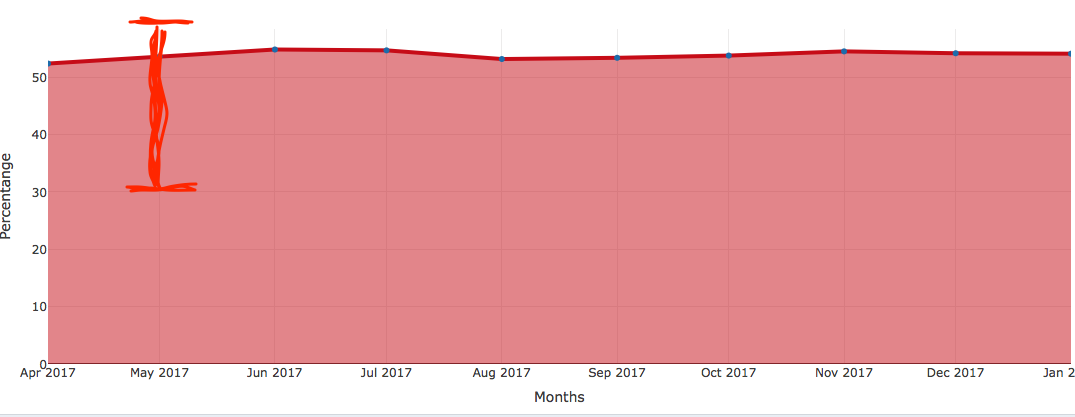
I have a plot using plotly r . As of now the variations cant be seen that much. So in order to do so if the y-axis is 0-70% is there a way to show just 50%-70% on y axis so the variation can be seen more clearly.
Below is code I am using
output$plot <- renderPlotly({
  if (is.null(ab()))
    return(NULL)
  y <- list(title = "Percentange")
  x <- list(title = "Months")
  plot_ly(ab(), x = ~ Month_considered, y = ~ pct * 100,type = 'scatter', mode = 'marker',
    fill = 'tozeroy', line = list(color = 'rgb(205, 12, 24)', width = 4)) %>%
    layout(xaxis = x, yaxis = y)
  })