Why are they so different?
Which one should I trust more?
How would I know I'm not missing any other key independent?
Please help or point me in the right direction
When you say prediction was 7.3
Prediction was 6
Do you mean that for one specific observation you have in mind, the first model predicted 7.3 for RestNB and the other 6?
I modelled last four years of March data. Predicted sales coming from remaining March days (eg: 13th -31st of Mar). Used observations from past March days (eg: 1st-12th Dec).
Each year we got between $5-$8K sales in March.
Sample size is about 600.
There are five years, so there are 120 subjects.
I see that the median residual is on the order of -1000. If the predicted values of 7 and 6.3 are on the same scale as the residuals, then that difference seems very small.
Yesterday's 7.3 prediction is now 7.48 today. It is 7,483,107 cents.
Apologies. I tried simplyfy problem but that may have caused more harm.
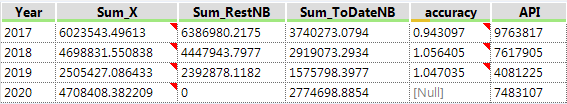
In above summary table,
Sum_X = Predicted value for rest of March. Actual prediction for 2020 March is 4,708,408
Sum_RestNB = Observded values from 14th - 31st of Mar.
Sum_ToDateNB= Observed values from 1st - 14th Mar.
accuracy = My simple calc to see how good the prediction is.
API = Sum_ToDateNB + Sum_X = 2,774,699 + 4,708,408 = 7,483,107