Hello,
I was able to make something out of Jienagu's work (see link below).
https://github.com/jienagu/Shiny_Full_Flow
https://forum.posit.co/t/shiny-contest-submission-capture-user-interaction-with-widget-for-reproducibility/23602
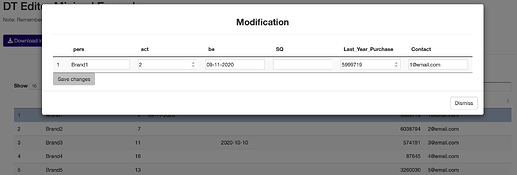
So I inserted in my main table a button that allows me to access modal() from the row selection.
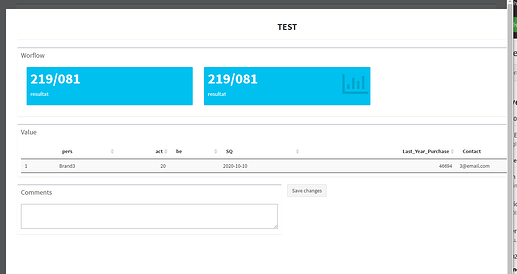
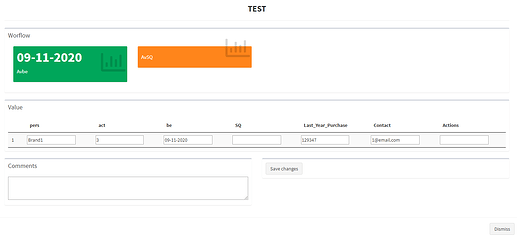
In the test page the selected row is displayed. I have DT::datatable I added the option editable='cells'.
I am now blocked to save the values (that I modified in the test page for the "be" and "sq" columns) in the main table.
Another point in the test page I would like to keep the comments I put but which will not be visible in the main table.
Do you have an idea?
Thanks in advance to your help!
rm(list = ls())
library(shiny)
library(shinydashboard)
library(data.table)
library(DT)
library(dplyr)

###########UI

ui<-dashboardPage(dashboardHeader(disable = T),
                  dashboardSidebar(disable = T),
                  dashboardBody(uiOutput("MainBody")
                  )

)

###############SERVER

server<-function(input, output) {

  #vals<-reactiveValues()
  #vals$Data<-wf%>%
  # select(-.data$Description_du_defaut)


  vals<-reactiveValues()
  #vals$Data<-wf
  vals$Data<-data.table(
              pers=paste0("Brand",1:10),
              act=sample(1:20,10),
              be=c("09-11-2020","","","","","10-10-2020","","","",""),
              SQ=c("","","2020-10-10","","","","","","","",""),
              Last_Year_Purchase=round(rnorm(10,1000,1000)^2),
              Contact=paste0(1:10,"@email.com")
   )

  output$MainBody<-renderUI({
    fluidPage(

      box(width=12,
          h3(strong("DATASET"),align="center"),
          hr(),
          column(12,dataTableOutput("Main_table")),
          tags$script("$(document).on('click', '#Main_table button', function () {
                                        Shiny.onInputChange('lastClickId',this.id);
                                        Shiny.onInputChange('lastClick', Math.random())
                                        });"),
          tags$head(tags$style(".modal-dialog{ width:1500px}")),
          tags$head(tags$style(".modal-body{ min-height:900px}")),
          tags$head(tags$style(".workflow{background-color:#230682;} .workflow{color: #e6ebef;}")),

      )
    )
  })

  output$Main_table<-renderDataTable({
                    DT=vals$Data
                    DT[["Actions"]]<-
                      paste0('
                                               <div class="btn-group" role="group" aria-label="Basic example">
                                               <button type="button" class="btn btn-secondary modify"id=workflow',1:nrow(vals$Data),'>Workflow</button>
                                               </div>
                                                ')

                    datatable(DT,
                              escape=F,rownames = FALSE)}
  )


  ##Managing in row deletion
  modal_modify<-modalDialog(

    fluidPage(
              h3(strong("TEST"),align="center"),
              hr(),
              fluidRow(
                        box(title = "Worflow"
                            ,width = 12
                            ,valueBoxOutput("ecr")
                            ,valueBoxOutput("bem")
                        )
                        ,br()
                        ,box(title = "Value"
                             ,width = 12
                             ,dataTableOutput('row_modif')
                        )
                        ,br()
                        ,box(title = "Comments",
                             tags$textarea(id    = 'markdowninput', rows  = 3, style = 'width:100%;'))
                        ,actionButton("save_changes","Save changes")
                        ,tags$script(HTML("$(document).on('click', '#save_changes', function () {
                                                          var list_value=[]
                                                          for (i = 0; i < $( '.new_input' ).length; i++)
                                                                                 {
                                                                                    list_value.push($( '.new_input' )[i].value)
                                                                                 }
                                                          Shiny.onInputChange('newValue', list_value)
                                                            });"))
      )),
    size="l"
  )


  observeEvent(input$lastClick,
               {
                 if (input$lastClickId %like% "workflow")
                 {
                   showModal(modal_modify)
                 }
               }
  )
  ###Modification
  output$row_modif<-renderDataTable({
                    selected_row=as.numeric(gsub("workflow","",input$lastClickId))
                    old_row=vals$Data[selected_row]
                    row_change=list()

                    for (i in colnames(old_row))
                    {
                      if (is.numeric(vals$Data[[i]]))
                      {
                        row_change[[i]]<-paste0('<input class="new_input" type="number" id=new_',i,'><br>')
                      }
                      else
                        row_change[[i]]<-paste0('<input class="new_input" type="text" id=new_',i,'><br>')
                    }
                    row_change=as.data.table(row_change)

                    DT=vals$Data[selected_row,]
                    DT},escape=F,options=list(dom='t',scrollX = TRUE),editable = 'cell'
  )

  observeEvent(input$newValue,
               {
                 newValue=lapply(input$newValue, function(col) {
                   if (suppressWarnings(all(!is.na(as.numeric(as.character(col)))))) {
                     as.numeric(as.character(col))
                   } else {
                     col
                   }
                 })
                 DF=data.frame(lapply(newValue, function(x) t(data.frame(x))))
                 colnames(DF)=colnames(vals$Data)
                 vals$Data[as.numeric(gsub("workflow","",input$lastClickId))]<-DF

               }
  )


  observeEvent(input$save_changes, {
    #vals$Data=vals$Data[input$newValue]

    # removeModal()
  })


  #PRoposition de solution :
  # faire comme dans le fichier exemple afficher le tableau
  output$bem<-renderValueBox({
    valueBox(
      paste0(wf[1,1], digits = 1)
      ,"resultat"
      ,icon = icon("bar-chart-o")
    )
  })

  output$ecr<-renderValueBox({
    valueBox(
      paste0(wf[1,1], digits = 1)
      ,"resultat"
      #,icon = icon("bar-chart-o")
    )
  })

}


shinyApp(ui, server)


