I have finally figured this out today with the code below
data %>%
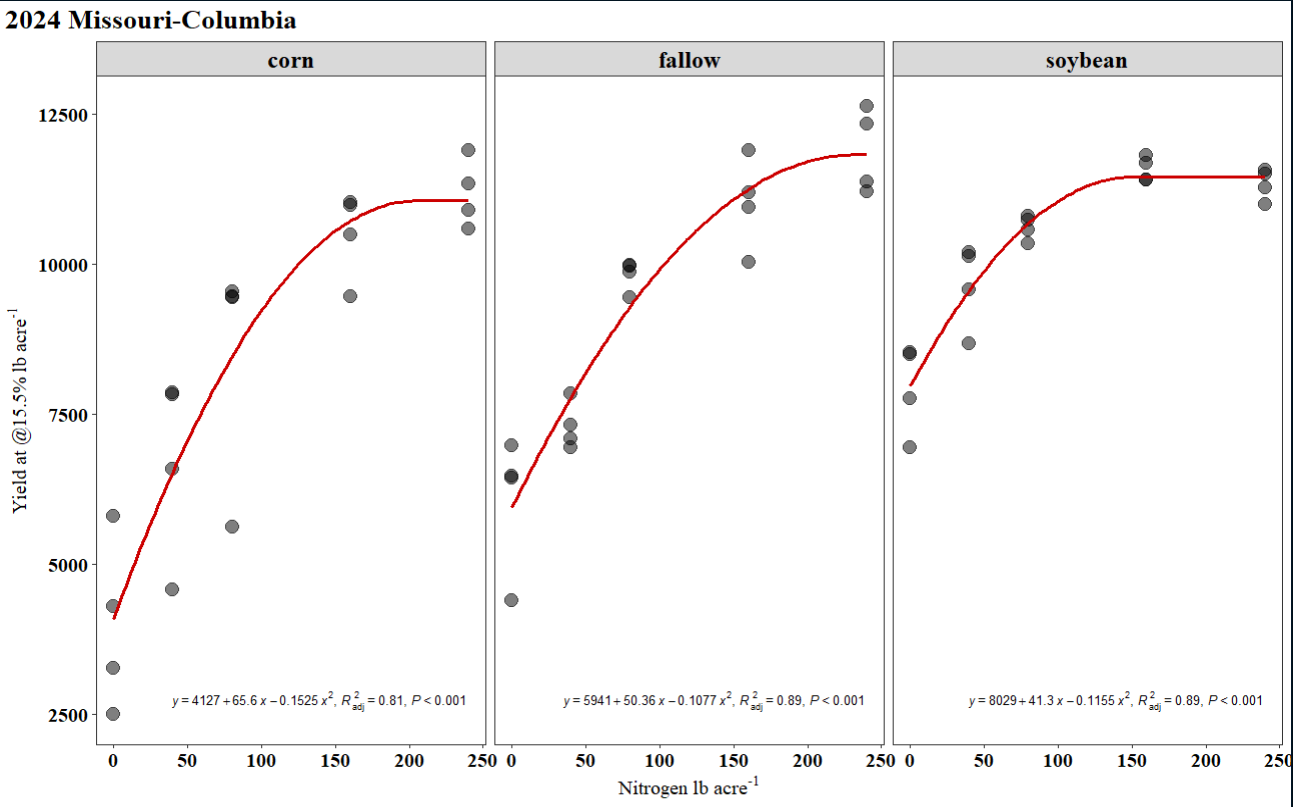
ggplot(aes(N_rate, Yield_lbs_ac)) +
geom_point(size = 4,
alpha = 0.5) +
geom_line(stat="smooth",
method = "nls",
formula = y ~ SSquadp3xs(x, a, b, jp),
se = FALSE,
color = "#CC0000",linewidth=1.2) +
stat_poly_eq(use_label('eq','adj.rr.label','P'),label.x = 'right',label.y = 'bottom',size=3,formula = y~poly(x,2,raw = T,coefs = F),coef.digits = 4)+ # This fixed the issue for me but I am still figuring out how to round the slope and quadratic term
facet_grid(~History)+
labs(title = paste(
"2024 Missouri-Columbia"),
y = expression('Yield at @15.5%'~'lb acre'^{"-1"}),
x = expression(Nitrogen~'lb acre'^{"-1"}))+
theme_bw()+
coord_cartesian(clip = 'off')+
theme(panel.grid = element_blank(),
strip.text.x = element_text(family = 'serif',face = 'bold',colour = 'black',size = 16),
axis.text = element_text(family = 'serif',face = 'bold',colour = 'black',size = 13),
axis.title = element_text(family = 'serif',face = 'bold',colour = 'black',size = 13),
plot.title = element_text(family = 'serif',face = 'bold',colour = 'black',size = 18),
plot.title.position = 'plot')