The Problem
Because R requires uniform data types in columns, openxlsx, openxlsx2 and others like writexl all have the same problem when attempting to write mixed data formats to excel:
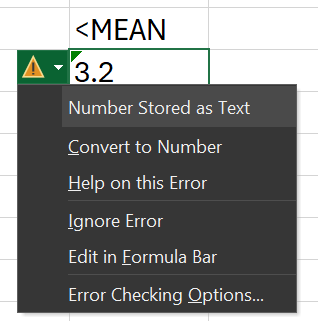
It can often be helpful for data presentation / delivery to have markers such as these rather than having 0, blank, or NA cells. It's also not desirable to have the end user manually convert all of these.
Potential Solutions
List-Cols
While excel does allow for mixed-type columns (and R does allow list-columns), it seems that both openxlsx and writexl coerce all values in a given column to a single uniform type, despite it seeming that from the source code the resulting excel workbooks are written cell-by-cell, which would allow for mixed-type columns with no issue. So, we can write off list-col as a potential solution (coerced all to char in my testing).
Excel Formula
One option was to try something like this using openxlsx, where we use the value function to evaluate each cell (Excel version of as.numeric):
data |>
    mutate(
        across(where(is.character), \(x) {
        # If value(x) fails, then replace it with the text version
            y <- paste0("=IFERROR(VALUE(\"", x, "\"), \"", x, "\")")
            class(y) <- "formula"
            y
        })
    )
However, this resulted in a similar looking error in excel, with the same green flags for "inconsistent formula". Again, for non-technical users this might give them kind of concern about the data integrity. So also we can write this one off.
Using na.string (openxlsx2)
One option I tested was setting values to NA and then using the na.strings argument to set the marker text. This actually does work well, but it has the downside of requiring you to use the same blank marker for every column in the dataframe.
One way to get around this would be to just write the data col-wise and supply a different na.strings argument for each numeric column.
This solution correctly sets the type of numeric values in Excel while retaining the text marker:
I didn't use this solution for two reasons:
- I just thought of it while writing this post
- It is in theory less extensible since you'd need to use the same marker for all columns of the data (a simple solution is to write your data colwise, which is also probably easier than what I ended up doing below lol).
My solution (two-pass writing)
The final, most extensible, and most involved solution is to write to the worksheet twice - this could be done in two different orders (char vs. numeric first), and the order would depend on the nature of the data. In my case it makes more sense to write numeric values first since they would differ, while the text filler is a constant for each column.
The steps for this are as follows:
- Create a modified dataframe where NA replaces all of the text marker cells
- Write the modified dataframe leaving NA cells blank.
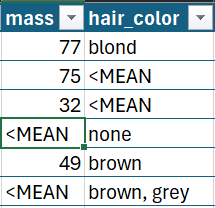
- Fill in the NA gaps with the text marker, in this example "<MEAN"
Steps 1 and 2 were simple enough, but writing in all of the NA cells took some organizing. Here was my approach:
1. Get list of NA dimensions to write:
na_rows <- mod_dat |>
    map(\(x) which(is.na(x) & is.numeric(x))) |>
    discard(is_empty) |>
    map(compress)
This compress function is doing a lot of work here. Writing with any excel writer package requires contiguous data - i.e., you can't skip around between rows in a single write step. This means we can't do all of our NA indices in one shot.
To minimize the number of writes required to fill each target cell with the text marker, we use a "compress" function to identify continuous sequences inside the NA indices. For example, c(1, 2, 3, 7, 10, 11) would return a list: list( c(1, 2, 3), c(7), c(10, 11) ). This greatly reduces the amount of write steps we need to perform. The compress function is below:
compress <- function(vec) {
    # unlikely since we are selecting cols ourselves
    if (length(vec) == 0) return(list())

    mainvec <- list()
    subvec <- c(vec[1])  # set first group

    for (i in 2:length(vec)) {
        if (vec[i] == vec[i - 1] + 1) {
            # If consecutive, add to current group
            subvec <- c(subvec, vec[i])
        } else {
            # If not, finalize the current group
            # and put it in the next one
            mainvec <- c(mainvec, list(subvec))
            subvec <- c(vec[i])
        }
    }

    # set last group - mainvec doesn't have last one if it's concurrent
    # potential for repeating the last group but no harm done for one of many
    mainvec <- c(mainvec, list(current_group))
}
Now we have a list of sequences by column that we need to write to the workbook. To do this I used map2 and called wb_dims to get the Excel notation for each subsequence. wb_dims is something that you could probably write yourself, but it's nice that it was included as a helper. It also performs the task of turning each subsequence into a range - "c(1, 2, 3, 4)" became "A2:A5", correctly omitting column headers. This returns a list with n for recycling our tag and dims for targeting which cell(s).
map2(na_rows, names(na_rows), \(rowvecs, nom) {
    rowvecs |>
        map(\(x) {
            list(
                dims = wb_dims(x = mod_dat, cols = nom, rows = x),
                n = length(x)
            )
        })
    # don't need col names anymore, we have dims!
})|> unlist(recursive = FALSE)
No, wb_dims is not vectorized unfortunately:
wb_dims(x = starwars, rows = c(1:10, 50:55)
# [1] "A2:N2,A3:N3,A4:N4,A5:N5,A6:N6,A7:N7,A8:N8,A9:N9,A10:N10,A11:N11,A51:N51,A52:N52,A53:N53,A54:N54,A55:N55,A56:N56"
2. Writing at specified dimensions to overwrite with the marker
So now we have a list of dims to which we can apply our writer function and fill in the gaps:
process_sheet_wb <- function(wb, sheet, dat, tag) {
    mod_dat <- dat |>
        mutate(
        across(where(\(x) any(x == tag, na.rm = TRUE)), as.numeric)
    )

    wb_edit <- wb |>
        wb_add_worksheet(sheet = sheet) |>
        wb_add_data_table(x = mod_dat, na.strings = "")

    na_dims <- create_na_dims_wb(mod_dat)

    na_dims |>
        reduce(.init = wb_edit, \(init, dim) {
            init |>
            # creating marker data to fill in
                wb_add_data(
                    x = rep(tag, dim$n)
                    dims = dim$dims,
                )
        })
}
3. Fixing Performance Issues
After testing this function though with a 10 sheet workbook, I was finding this took over 1 min! The largest dataframe was around 9,000 rows with perhaps 6 columns, so not nearly enough to choke any actual processing.
I initially considered my compress function and wondered if for long sequences it could be a net negative on write performance - however, tested it and even rewriting it in C++ did not make a difference, so it is was definitely not an issue.
I have had issues with writing individual blocks of formatting using openxlsx in the past, so I immediately was suspicious of my many write steps - however, I had already optimized it as much as possible, so the only next place I could look was to parallelization.
I tried two different schemes: furrr and foreach + doParallel.
Both solutions were easy enough to write up, but foreach really ensures you know that you are spawning new R processes by requiring you to stipulate the libraries and data (read, functions) you need to expose to each process:
furrr
parallel_process_sheets <- function(dat_list) {
    # tried multicore vs. multisession, no change
    future::plan(multicore)

    wb <- wb_workbook()

    formatted_books <- furrr::future_map(dat_list, \(dat) {
        if (is.na(dat$tag)) {
            wb_workbook() |>
                wb_add_worksheet(sheet = dat$name) |>
                wb_add_data_table(sheet = dat$name, x = dat$data, na.strings = "")
        } else {
            wb_workbook() |> process_sheet(dat$name, dat$data, dat$tag)
        }
    })

    future::plan(sequential) # setting it back since plan is global

    formatted_books # to be joined using reduce + wb_clone_worksheet
}
foreach
foreach_process_sheets <- function(dat_list) {

    cl <- makeCluster(4)
    registerDoParallel(cl)

    formatted_books <- foreach(
        dat = dat_list,
        .packages = c("openxlsx2", "dplyr", "purrr"), # may need more
        .export = c("process_sheet", "create_na_dims", "compress")
    ) %dopar% {
        if (is.na(dat$tag)) {
            wb_workbook() |>
                wb_add_worksheet(sheet = dat$name) |>
                wb_add_data_table(sheet = dat$name, x = dat$data, na.strings = "")
        } else {
            wb_workbook() |> process_sheet(dat$name, dat$data, dat$tag)
        }
    }

    stopCluster(cl)

    formatted_books
}
These are in seconds, mind you - no improvement at all for parallelization!
| expr | min | lq | mean | median | uq | max | neval |
|---|---|---|---|---|---|---|---|
| process_sheets(results) | 74.78 | 75.40 | 77.56 | 77.62 | 78.41 | 81.58 | 5 |
| parallel_process_sheets(results) | 74.49 | 75.27 | 76.69 | 75.75 | 77.05 | 80.87 | 5 |
4. Profiling
So after trying a lot of different layouts, I decided to use profvis to see where the problem actually was, since my guess was clearly very wrong:
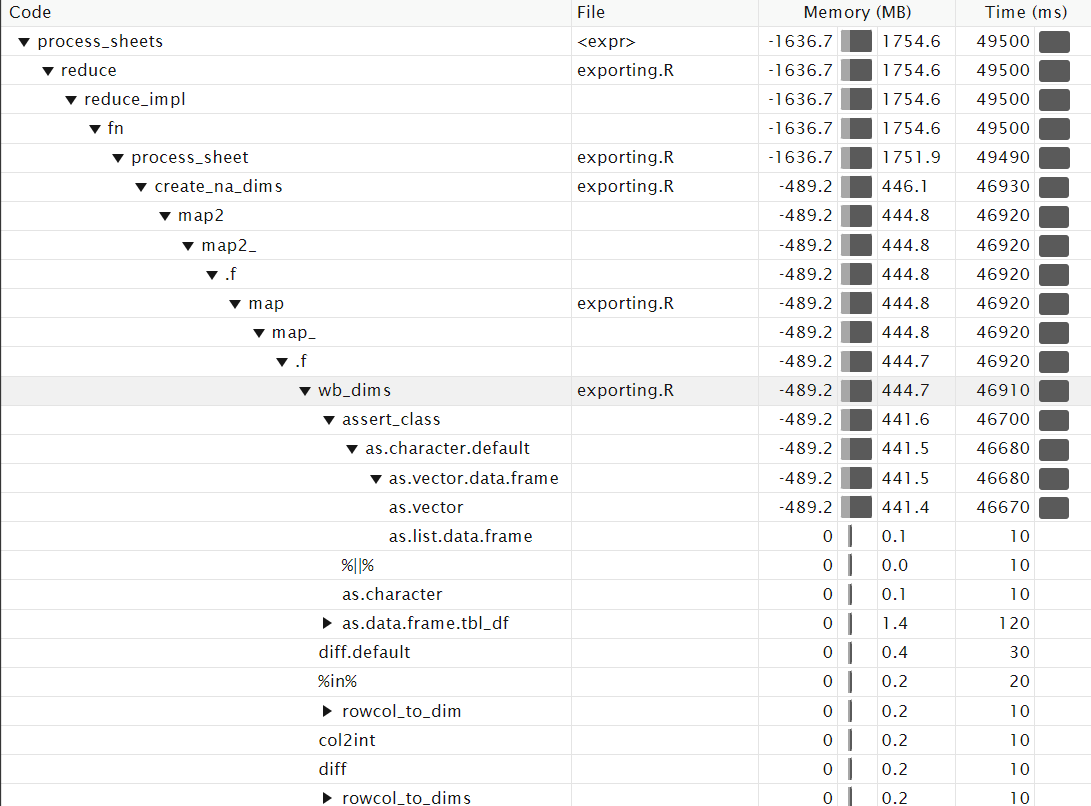
The highlighted row shows that of all things, our wb_dims function call is the main problem! While I could go in and see how this might be improved, I decided to fix my usage of it instead. (Additionally, it looks like it's the assert_class business that's almost the entirety of the slowdown, which may point towards a bug? Unsure)
The problem was that I was using it while I was mapping over my list of contiguous cells for each column, so it was being called a lot (likely tens of thousands of times in total). This is the map extracted from the code in step 1:
Original:
map2(na_rows, names(na_rows), \(rowvecs, nom) {
    rowvecs |>
        map(\(x) {
            list(
	            # here is the problem!
                dims = wb_dims(x = mod_dat, cols = nom, rows = x),
                n = length(x)
            )
        })
})|> unlist(recursive = FALSE) # don't need col names anymore, we have dims!
Revised:
map2(na_rows, names(na_rows), \(rowvecs, nom) {

    # now only once per col rather than once per seq.
    col_letter <- wb_dims(x = mod_dat, cols = nom, rows = 1) |>
	    str_extract("(?i)[a-z]+")
    rowvecs |>
        map(\(x) {
            list(
                # making dims by hand to avoid wb_dims for each subseq
                dims = col_letter |>
	                # + 1 to avoid colnames
                    paste0(c(min(x+1), max(x+1))) |>
                    unique() |>
                    paste0(collapse = ":"),
                n = length(x)
            )
        })
})
With the revision, we call wb_dims only once for each column rather than for each subvec of each column. Now we can ditch the parallel approach and compare things with our new scheme - again, these are in seconds. We see a >10X improvement!!
| expr | min | lq | mean | median | uq | max | neval |
|---|---|---|---|---|---|---|---|
| process_sheets(results) | 74.69 | 75.06 | 76.87 | 77.61 | 77.90 | 79.11 | 5 |
| process_sheets_revised(results) | 5.34 | 5.34 | 5.49 | 5.36 | 5.54 | 5.86 | 5 |
At this point we don't even need parallel writing - 5 s is completely manageable.
Conclusions
I think the biggest lesson learned here was to always profile first before trying to handle things you think are the problem - if I hadn't tried profvis I would have never guessed that wb_dims was the main contributor to the slowdown, and I probably would have assumed I was doing the parallelization incorrectly.
As a general rule, I have also learned that calling package functions in very long or nested loops is a bad idea - even if they are useful, they are very likely to be slower than programming it yourself in base R. All I needed to do was to take an extra 5 minutes to format the dims for openxlsx myself with two paste0 calls.
Recommendations
In the long term, I think we desperately need a multi-format excel writer. In python, object is used to represent mixed-type dataframe columns and the built-in excel writer for pandas handles this completely fine. It does not really make sense that R supports mixed-type columns via list but then no excel writer package correctly handles these mixed-types when actually writing the excel workbook.
Since it appears that at least openxlsx writes cell-by-cell, there would likely be no large performance hit to include a mixed-type option to allow Excel to infer datatypes rather than coercing each column to a uniform type prior to writing.
Thanks for reading, and if you know anything deeper about writing excel files I would love to hear ideas for making mixed-types and/or Excel type-inference deference (lol) possible!