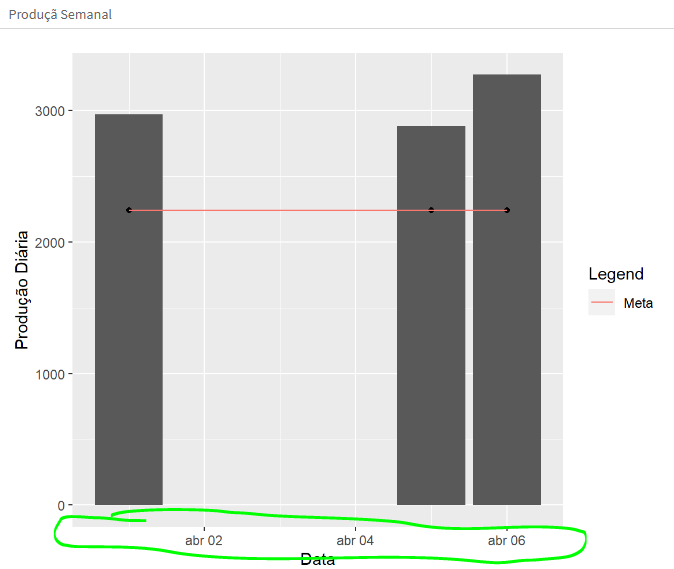
Hi people. I have a problem. i need to plot a bar graph with the axis in days, the x axis does not show dates in all intervals.
How can I correct that??
Code
df_modulos %>% ggplot(aes(x = data, y = quantidade)) +
geom_bar(stat="identity")+
geom_point(aes(x = data, y = meta_modulos)) +
geom_line(aes(x = data, y = meta_modulos,color = "Meta"))+
labs(x = "Data",
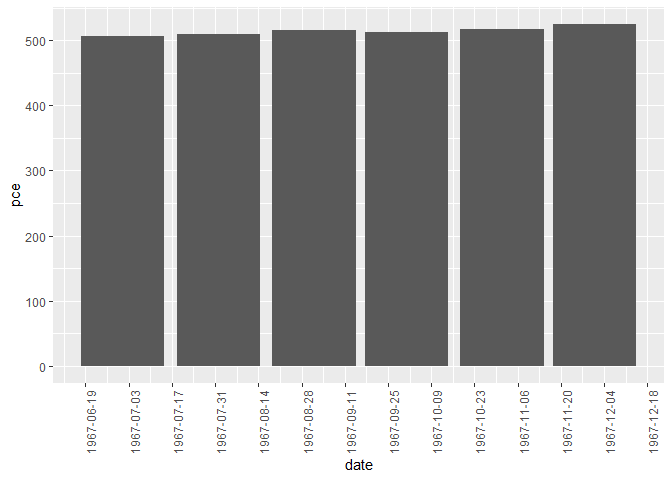
In the example below the default breaks were 1 month, but I overwrite them to make breaks every 2 weeks (which is counterintuitive for given data but shows the concept).
For your specific case use date_breaks = "1 day".
suppressMessages(library(tidyverse))
suppressMessages(library(lubridate))

df <- economics %>%
  filter(date < ymd("1967-12-31"))

ggplot(df, aes(x = date,
               y = pce))+
  geom_col() +
  # You can manipulate breaks in the following way
  # Use set value "1 day" for breaks on each day
  scale_x_date(date_breaks = "2 weeks")+
  theme(axis.text.x = element_text(angle = 90))