Hi, This is a new error that resulted from a previous help request suggestion.
I would like to automatically render the same plot for different "names" in html Rmarkdown.
library(ggrepel)

example <- data.frame(
  number = as.numeric(c("1", "6", "12", "2", "3", "5", "53")),
  variable = c("Low", "Low", "Low", "Normal", "Exaggerated", "Exaggerated", "NA"),
  date = as.Date(c("1991-01-08", "1991-02-05", "1991-03-05", "1991-01-13", "1991-01-15", "1991-01-29", "NA")),
  words = rep("NA", 7),
  second_number = c("20", "10", "5", "100", "20", "5", "NA"),
  third_number = c("20", "10", "5", "99", "20", "5", "NA"),
  name = c("Aname", "Aname", "Aname", "Cname", "Cname", "Cname", "IGNORE"),
  fourth_number = c("20", "7", "5", "97", "19", "5", "NA"),
  fifth_number = c("0", "0", "0", "0", "0", "0", "NA"),
  sixth_number = c("0", "3", "0", "2", "1", "0", "NA"),
  seventh_number = c("0", "0", "0", "0", "0", "0", "NA"),
  more_words = rep("NA", 7),
  eighth_number = as.numeric(c("1.0", "0.7", "0.1", "0.979", "0.950", "1.000", "NA")),
  stringsAsFactors = FALSE
)

map(
  # for each variable in .x
  .x = unique(example$name),
  # do .f
  .f = ~ filter(example, name == .x) %>% # filter by .x
    ggplot( # plot
    mapping = aes(
      x = date,
      y = eighth_number,
      group = variable,
      color = variable
    )
  ) +
    geom_point(size = 1) +
    labs(
      title = str_c(.x),
      x = "date",
      y = "eighth number"
    ) +
    geom_line() +
    theme_bw() +
    scale_x_date(date_labels = "%b %Y", date_breaks = "month",
                 limits = as.Date("1991-12-01", "1992-02-01"))+
    geom_label_repel(aes(label = format(date, format = "%b %d")),
                   size = 3,
                   hjust=0.5,
                   vjust=1,
                   angle=90,
                   box.padding   = 0.25,
                   point.padding = 0.5,
                   segment.color = 'grey50')
)
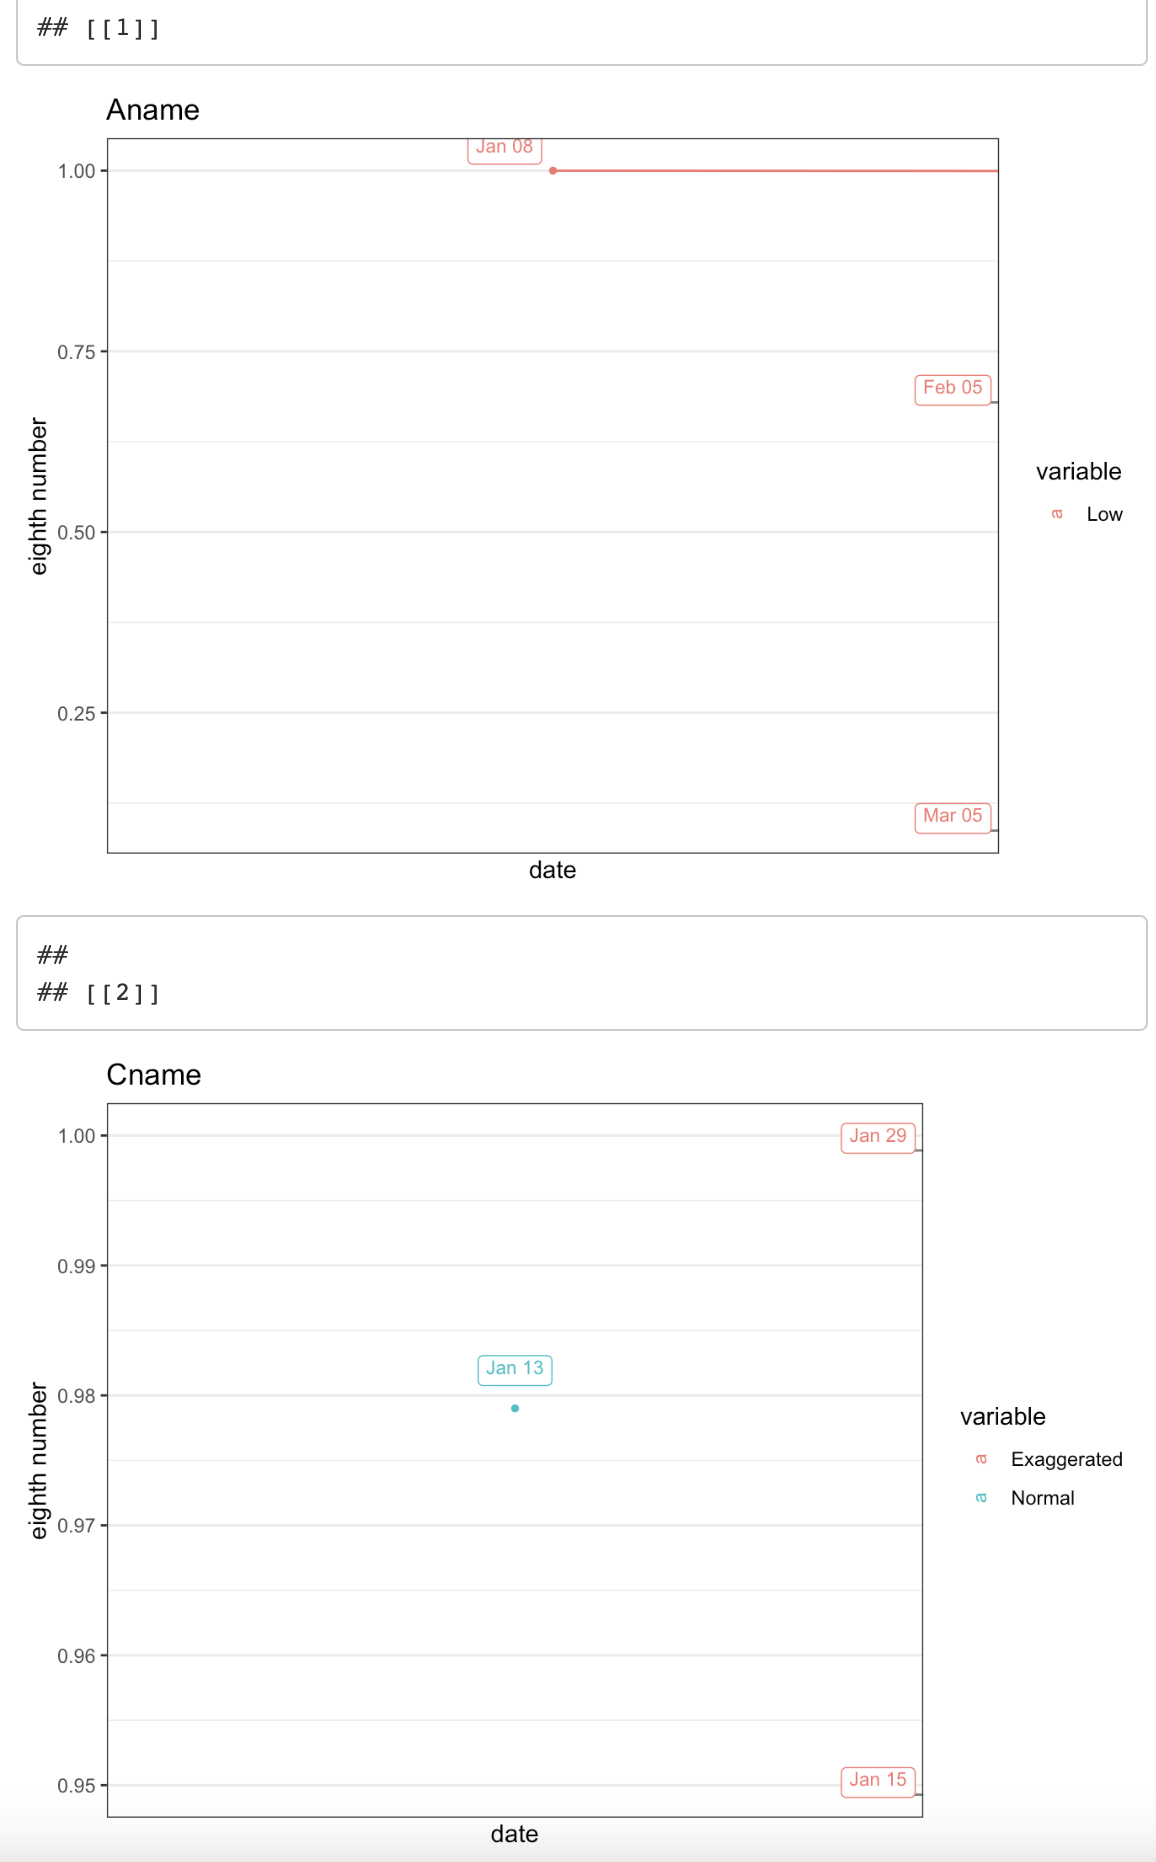
However, the axis scales are not consistent, and not all points are displayed for each plot.
My plots (that have data) look like this:
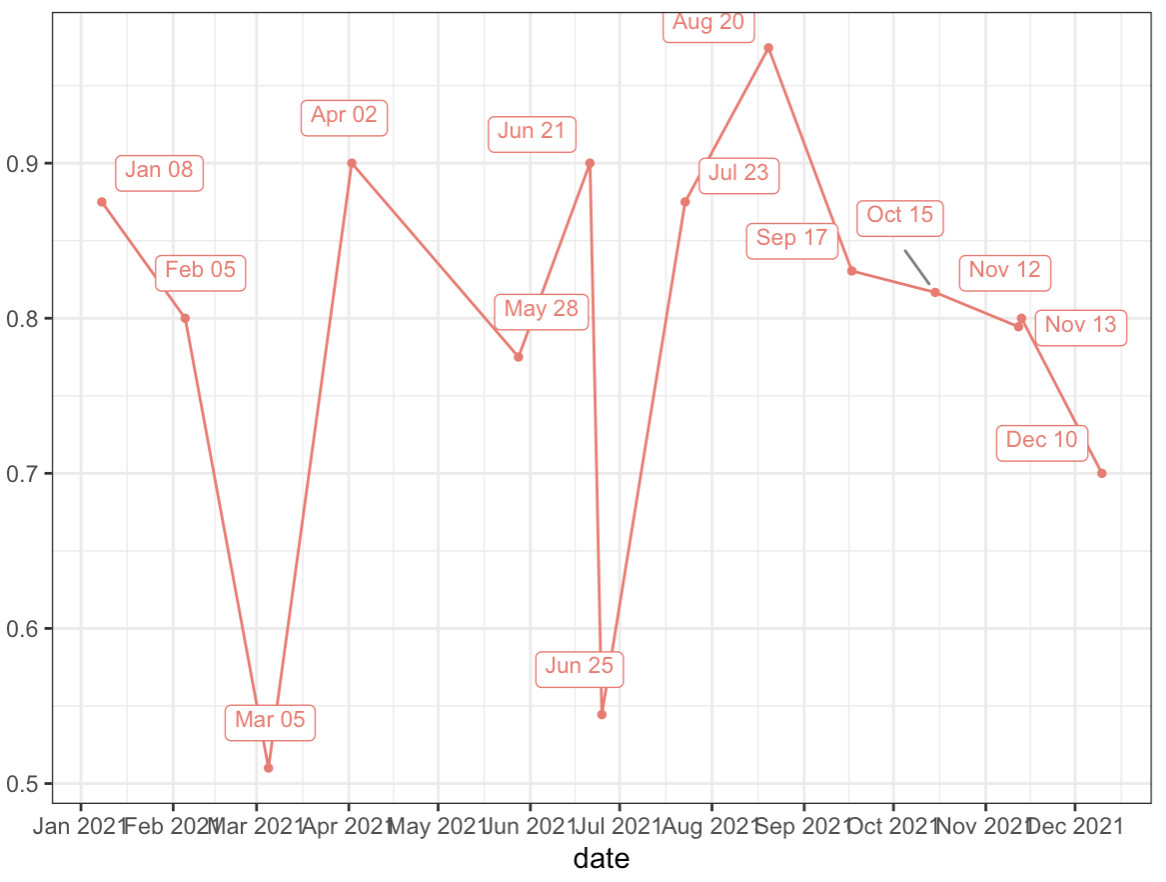
An ideal plot would look more or less like this, a legend, axis labels, and title: