meitei
October 14, 2021, 10:05pm
1
how can I merge this two plots?
Thanks
library(tidyr)
library(openair)

dat=data.frame(
  a=runif(100),
  b=runif(100)
)
dat = gather(dat, columnNames, values)
colnames(dat)=c("model", "x")
dat$b=runif(200)


# plot-1
ggplot(dat, aes(x = x, y = b, group = model,
                color = model, shape = model)) +
  geom_point( aes(colour = model))

#plot-2
dat <- selectByDate(mydata, year = 2003)
dat <- data.frame(date = mydata$date, obs = mydata$nox, mod = mydata$nox)
dat <- transform(dat, month = as.numeric(format(date, "%m")))
mod1 <- transform(dat, mod = mod + 10 * month + 10 * month * rnorm(nrow(dat)),
                  model = "model 1")
mod1 <- transform(mod1, mod = c(mod[5:length(mod)], mod[(length(mod) - 3) :
                                                          length(mod)]))

mod2 <- transform(dat, mod = mod + 7 * month + 7 * month * rnorm(nrow(dat)),
                  model = "model 2")
mod3 <- transform(dat, mod = mod + 3 * month + 3 * month * rnorm(nrow(dat)),
                  model = "model 3")
mod.dat <- rbind(mod1, mod2, mod3)
TaylorDiagram(mod.dat, obs = "obs", mod = "mod", group = "model")

##Trial

mat <- matrix(c(1, 2,  # First, second
                3, 3), # and third plot
              nrow = 2, ncol = 2,
              byrow = TRUE)

layout(mat = mat)

plot1
plot2
####
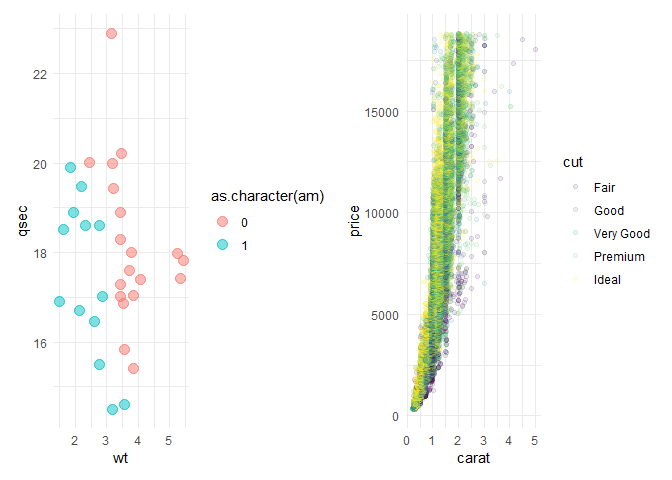
If your data is all in one dataframe and you want to create separate plots based on a specific variable (e.x., if you want to plot GDP vs year for several countries), facet_wrap()patchwork package for merging plots that don't come from the same df (& cant use facet_wrap()):
library(tidyverse)
library(patchwork)

p1 <-
  as_tibble(mtcars) %>%
  ggplot(aes(x = wt,
             y = qsec,
             color = as.character(am))) +
  geom_point(size = 3.5,
             alpha = 0.5) +
  theme_minimal()

p2 <-
  as_tibble(diamonds) %>%
  ggplot(aes(x = carat,
             y = price,
             color = cut)) +
  geom_point(size = 1.5,
             alpha = 0.1) +
  theme_minimal()

p1 + p2
Created on 2021-10-14 by the reprex package (v2.0.1)
1 Like
meitei
October 14, 2021, 10:40pm
3
@markjrieke Thank you for your response. Could you please try with the specific Taylor diagram which is given as? I tried with your approach but I couldn't do it.
meitei:
dat <- selectByDate(mydata, year = 2003)
dat <- data.frame(date = mydata$date, obs = mydata$nox, mod = mydata$nox)
dat <- transform(dat, month = as.numeric(format(date, "%m")))
mod1 <- transform(dat, mod = mod + 10 * month + 10 * month * rnorm(nrow(dat)),
                  model = "model 1")
mod1 <- transform(mod1, mod = c(mod[5:length(mod)], mod[(length(mod) - 3) :
                                                          length(mod)]))

mod2 <- transform(dat, mod = mod + 7 * month + 7 * month * rnorm(nrow(dat)),
                  model = "model 2")
mod3 <- transform(dat, mod = mod + 3 * month + 3 * month * rnorm(nrow(dat)),
                  model = "model 3")
mod.dat <- rbind(mod1, mod2, mod3)
TaylorDiagram(mod.dat, obs = "obs", mod = "mod", group = "model")
I think patchwork may only work with ggplot objects - if you can create the plot called by TaylorDiagram() in a ggplot, you should be able to combine!
meitei
October 15, 2021, 4:40pm
5
@markjrieke could you suggest how can I give the numbering of these figures like (a) (b).
patchwork has some documentation that is worth exploring; if you add a title to your plots then add with patchwork, the plot titles will be included!
1 Like
system
November 5, 2021, 5:04pm
8
This topic was automatically closed 21 days after the last reply. New replies are no longer allowed.