If I understand the input and output correctly
library(data.table)
library(gt)
DT <- data.table(
year = c(
2007, 2008, 2007, 2007, 2006, 2004,
2004, 2002, 2005, 2003, 2006, 2002, 2004, 2002, 2009,
2007, 2000, 2009, 2002, 2006, 2005, 2001, 2004, 2005,
2003, 2009, 2002, 2001, 2009, 2007, 2004, 2005, 2000,
2009, 2007, 2005, 2001, 2009, 2001, 2009, 2003, 2008,
2007, 2007, 2001, 2000, 2006, 2002, 2000, 2008, 2009,
2004, 2008, 2001, 2006, 2007, 2008, 2003, 2008, 2000,
2005, 2006, 2000, 2001, 2007, 2004, 2009, 2004, 2007,
2005, 2008, 2000, 2003, 2000, 2000, 2001, 2003, 2004,
2000, 2001, 2005, 2006, 2001, 2005, 2007, 2005, 2002,
2003, 2008, 2005, 2007, 2007, 2009, 2004, 2002, 2008,
2008, 2000, 2009, 2004
),
specimen = c(
"blood", "urine", "blood",
"blood", "urine", "blood", "urine", "urine", "urine", "blood",
"urine", "urine", "blood", "blood", "urine", "urine", "blood",
"urine", "urine", "urine", "urine", "urine", "urine", "blood",
"urine", "blood", "blood", "urine", "urine", "blood", "urine",
"blood", "urine", "urine", "urine", "urine", "urine", "urine",
"urine", "urine", "urine", "blood", "urine", "urine", "blood",
"urine", "urine", "urine", "urine", "urine", "urine", "blood",
"blood", "blood", "blood", "urine", "urine", "blood", "urine",
"blood", "blood", "urine", "blood", "blood", "blood", "urine",
"urine", "urine", "blood", "urine", "blood", "urine", "blood",
"urine", "blood", "blood", "urine", "urine", "urine", "blood",
"urine", "blood", "urine", "urine", "blood", "urine", "urine",
"urine", "urine", "blood", "urine", "blood", "urine", "blood",
"blood", "blood", "blood", "urine", "blood", "blood"
),
isolates = c(
30,
16, 33, 70, 94, 24, 51, 49, 97, 33, 84, 91, 23, 82,
1, 28, 11, 18, 35, 33, 5, 41, 69, 77, 47, 85, 53,
46, 2, 55, 44, 73, 17, 38, 24, 88, 1, 8, 88, 94,
73, 79, 15, 12, 40, 40, 26, 77, 71, 16, 6, 65, 52,
36, 30, 46, 25, 98, 63, 61, 36, 57, 23, 3, 14, 97,
1, 44, 6, 84, 90, 26, 44, 31, 31, 24, 15, 84, 65,
61, 34, 77, 38, 23, 69, 93, 75, 55, 57, 54, 1, 3,
70, 43, 99, 29, 13, 74, 41, 24
), resistant = c(
3, 2,
1, 1, 0, 3, 1, 1, 1, 3, 1, 1, 3, 1, 72, 4, 2, 0, 3, 2, 6, 1,
1, 0, 1, 1, 2, 0, 49, 1, 0, 1, 2, 2, 2, 0, 65, 8, 0, 0, 0, 1,
6, 2, 2, 0, 0, 1, 1, 1, 3, 1, 2, 1, 2, 1, 3, 1, 1, 1, 1, 1, 3,
32, 1, 1, 20, 2, 5, 1, 1, 1, 1, 1, 0, 0, 4, 1, 1, 0, 2, 0, 2,
1, 1, 1, 1, 1, 1, 0, 63, 3, 1, 2, 1, 2, 4, 1, 0, 2
)
)
head(DT)
#> year specimen isolates resistant
#> 1: 2007 blood 30 3
#> 2: 2008 urine 16 2
#> 3: 2007 blood 33 1
#> 4: 2007 blood 70 1
#> 5: 2006 urine 94 0
#> 6: 2004 blood 24 3
tab1 <- DT[,.(isolates = round(mean(isolates),2),
resistant = round(mean(resistant),2),
proportion = round(mean(resistant/isolates),2)),
keyby = .(year, specimen)]
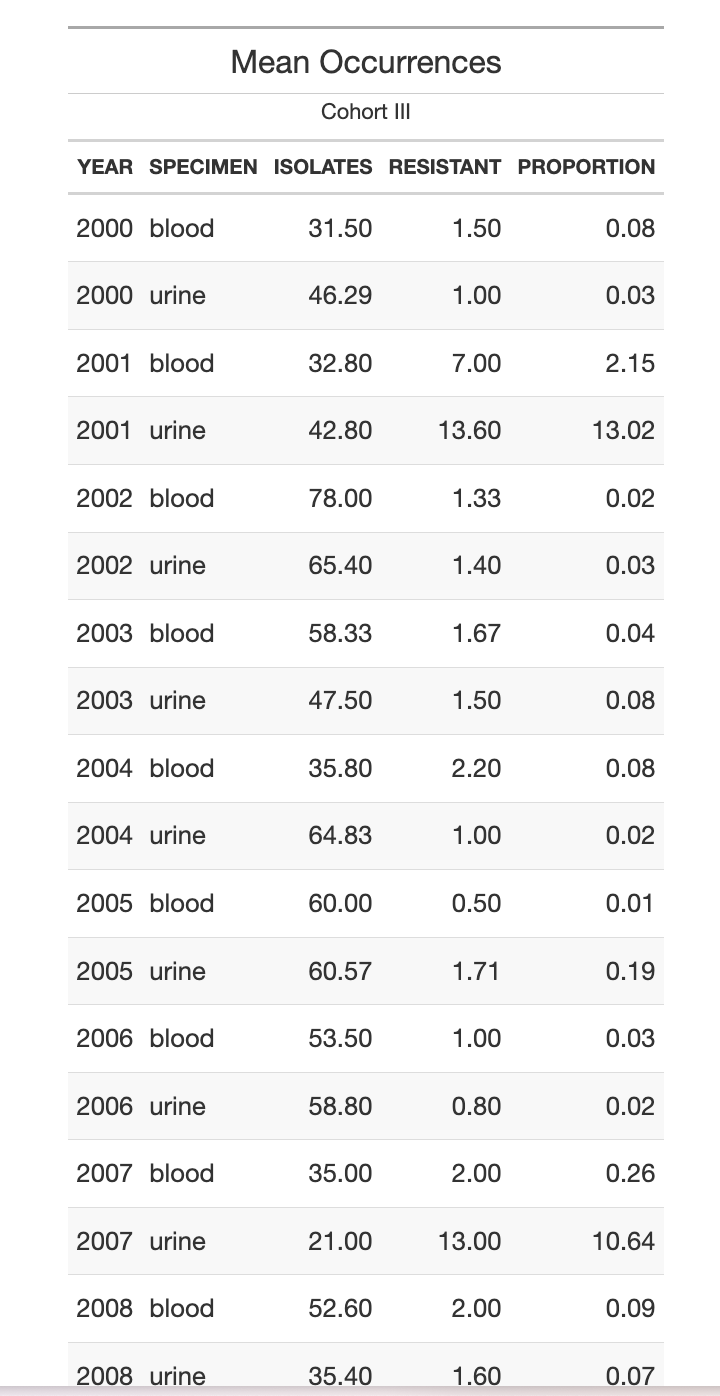
tab1 |>
gt() |>
tab_header(,
title = "Mean Occurrences",
subtitle = "Cohort III") |>
opt_all_caps()
will produce this style of table (screenshot because HTML markup by {gt] cannot be readily displayed here)