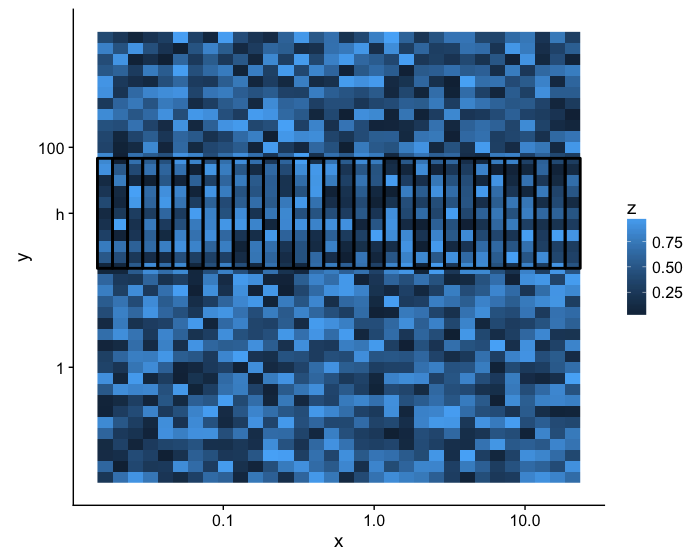
I have the following code which should put a tiles around the row with y = h.
library(tidyverse)
n_x <- 10^seq(log10(6), log10(24*365), by = 0.1)/365
n_y <- 10^seq(-1, 3, by = 0.1)

a <- tibble(x = rep(n_x, length(n_y)),
            y = rep(n_y, each = length(n_x)),
            z = runif(length(n_x)*length(n_y)))

h <- a$y[which.min(abs(a$y - 1.14*24))]

h.tb <- a %>%
  dplyr::filter(y == h)

a %>%
  ggplot(aes(x = x, y = y)) +
  geom_raster(aes(fill = z)) +
  scale_x_log10() +
  scale_y_log10(breaks = c(1, h, 100), labels = c('1', 'h', '100')) +
  geom_tile(data = h.tb, fill = NA, colour = 'black', size = 1)
But that's not what's happening...
Any help would greatly be appreciated.
1 Like
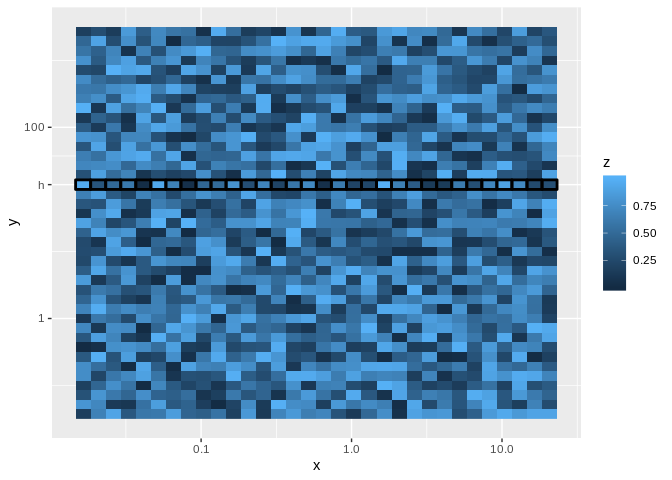
I'm not sure why it's doing what it's doing, but geom_tile does have a height argument that seems to be correcting if you set to 0.1, instead of 1:
library(tidyverse)
n_x <- 10^seq(log10(6), log10(24*365), by = 0.1)/365
n_y <- 10^seq(-1, 3, by = 0.1)

a <- tibble(x = rep(n_x, length(n_y)),
            y = rep(n_y, each = length(n_x)),
            z = runif(length(n_x)*length(n_y)))

h <- a$y[which.min(abs(a$y - 1.14*24))]

h.tb <- a %>%
  dplyr::filter(y == h)

a %>%
  ggplot(aes(x = x, y = y)) +
  geom_raster(aes(fill = z)) +
  scale_x_log10() +
  scale_y_log10(breaks = c(1, h, 100), labels = c('1', 'h', '100')) +
  geom_tile(data = h.tb, fill = NA, colour = 'black', size = 1, height = 0.1)
Created on 2018-07-26 by the reprex package (v0.2.0).
2 Likes
Thanks @mishabalyasin.
I noticed that when I change by = 0.1 in n_y to some different value, the height of geom_tile needs to be changed to that same value as well.
Ah, you are right. I didn't notice by in the code before.
Then two things are connected  , so you can set it one place and it'll work.