map2 my own function does not work

I have my own multiple ELISA(enzyme-linked immunosorbent assay) dataset like following.

> dat
# A tibble: 42 × 3
   CURVE  conc observation
   <fct> <dbl>       <dbl>
 1 1      0          1.81 
 2 1      0          1.87 
 3 1      0          1.96 
 4 1      0.62       1.39 
 5 1      0.62       1.16 
 6 1      0.62       1.06 
 7 1      1.85       0.994
 8 1      1.85       0.833
 9 1      1.85       0.833
10 1      5.56       0.725
# … with 32 more rows

I could fit 4 parameters logistic curve to my calibration-standards and get parameters using broom , purrr, drc. (I followed bloom and dplyr, it's pretty efficient way!!)

library(broom)
library(dplyr)
library(tidyr)
library(tibble)
library(ggplot2)
library(purrr)
library(drc)

## Generate calibration standard's data
spinach %>%
    select(-HERBICIDE) %>%
    rename(conc=DOSE) %>%
    rename(observation=SLOPE) %>%
    filter(CURVE==1 | CURVE==3) %>%
    mutate(CURVE=as.factor(CURVE)) -> dat


## For plotting calibration curve
xx <- seq(0, 150, 0.1)
bind_rows(data.frame(xx=xx, CURVE=1),
          data.frame(xx=xx, CURVE=3)) %>%
    nest(xx = -CURVE) %>%
    mutate(CURVE=as.factor(CURVE)) -> xx

## Regression & drawing curve
dat %>%
    nest(data = -CURVE) %>%
    left_join(xx, by='CURVE') %>%
    mutate(
        fit = map(data, ~ drm(observation ~ conc, data = .x, fct=LL.4())),
        tidied = map(fit, tidy),
        augmented = map2(fit, xx, ~augment(.x, newdata=.y))
    )%>%
    unnest(augmented, name_repair='unique') %>%
    ggplot(aes(x=xx1, y=.fitted, color=CURVE)) +
    xlab('conc') +
    ylab('observation') +
    geom_line() -> g

## Add original point
g + geom_point(data=dat, aes(x=conc, y=observation, color=CURVE)) +
    facet_wrap(~CURVE) -> g

g

Then, how can I know sample's 'conc' with 'tidy' coding style? I tried to map inverse function of 4PL, but output data type was 'function'(should be 'double').... Thanks!!

## Now I would like to know following unknown sample's conc.. how can I do in efficient way? 

new.observation <- bind_rows(data.frame(observation=c(1.6, 0.6, 0.25), CURVE=as.factor(1)),
                             data.frame(observation=c(0.8, 0.26, 0.2), CURVE=as.factor(3)))

new.observation
## >   observation CURVE
## 1        1.60     1
## 2        0.60     1
## 3        0.25     1
## 4        0.80     3
## 5        0.26     3
## 6        0.20     3


inverse.LL4 <- function(fit, observe){
    
    y <- observe[[1]]
    
    b <- fit[[1]]$coefficients[1]
    c <- fit[[1]]$coefficients[2]
    d <- fit[[1]]$coefficients[3]
    e <- fit[[1]]$coefficients[4]

    conc <- exp(log((d-y)/(y-c))/b + log(e))
    
    return(conc)
}

new.observation %>%
    nest(new.observation= -CURVE) -> no

datd %>%
    left_join(no, by='CURVE') %>%
    mutate(pred=map2(fit, new.observation, ~inverse.LL4)) %>%
    select(pred)

## A tibble: 2 × 1
#  pred  
#  <list>
#1 <fn>  
#2 <fn>  
#> 
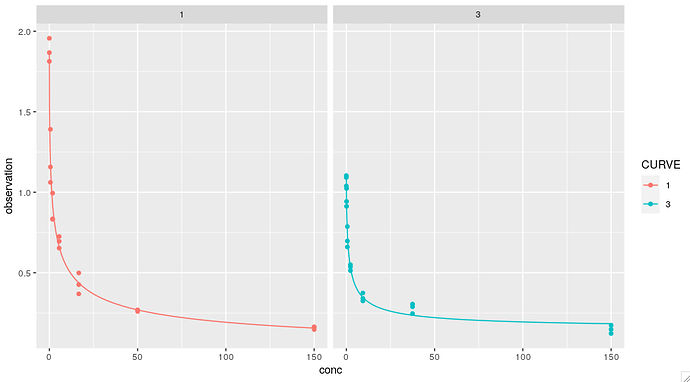


Try removing the ~ in front of ~inverse.LL4 in the map2 statement. The ~ is for an inline function, but you are providing a regular function.

Hi arthur,
I followed your comment and map2 worked as intended! In addition, your comment helps me to understand map2 documentation(Map over multiple inputs simultaneously. — map2 • purrr). Thanks for your quick and informative comment!

(Following is a memo that I modified according to you comment)

library(drc)   ## mask dplyr's select, 
library(broom)
library(dplyr)
library(tidyr)
library(tibble)
library(ggplot2)
library(purrr)

## Generate calibration standard's data
spinach %>%
    as_tibble(spinach) %>%
    select(-HERBICIDE) %>%
    rename(conc=DOSE) %>%
    rename(observation=SLOPE) %>%
    filter(CURVE==1 | CURVE==3) %>%
    mutate(CURVE=as.factor(CURVE)) -> dat

## For plotting calibration curve
xx <- seq(0, 150, 0.1)
bind_rows(data.frame(xx=xx, CURVE=1),
          data.frame(xx=xx, CURVE=3)) %>%
    nest(xx = -CURVE) %>%
    mutate(CURVE=as.factor(CURVE)) -> xx

## Regression & drawing curve
dat %>%
    nest(data = -CURVE) %>%
    left_join(xx, by='CURVE') %>%
    mutate(
        fit = map(data, ~ drm(observation ~ conc, data = .x, fct=LL.4())),
        tidied = map(fit, tidy),
        augmented = map2(fit, xx, ~augment(.x, newdata=.y))
    ) -> datd

datd %>%
    unnest(augmented, name_repair='unique') %>%
    ggplot(aes(x=xx1, y=.fitted, color=CURVE)) +
    xlab('conc') +
    ylab('observation') +
    geom_line() -> g

## Add original point
g + geom_point(data=dat, aes(x=conc, y=observation, color=CURVE)) +
    facet_wrap(~CURVE) -> g
## g

## Now I would like to know following unknown sample's conc.. how can I?
new.observation <- bind_rows(data.frame(observation=c(1.6, 0.6, 0.25), CURVE=as.factor(1)),
                             data.frame(observation=c(0.8, 0.26, 0.2), CURVE=as.factor(3)))

## new.observation
## >   observation CURVE
## 1        1.60     1
## 2        0.60     1
## 3        0.25     1
## 4        0.80     3
## 5        0.26     3
## 6        0.20     3

inverse.LL4 <- function(fit, observe){
    y <- observe[[1]]
    b <- fit$coefficients[1]
    c <- fit$coefficients[2]
    d <- fit$coefficients[3]
    e <- fit$coefficients[4]
    conc <- exp(log((d-y)/(y-c))/b + log(e))
    return(conc)
}


new.observation %>%
    nest(new.observation= -CURVE) -> no


datd %>%
    left_join(no, by='CURVE') %>%
    mutate(pred=map2(fit, new.observation, inverse.LL4)) %>%
    select(CURVE, pred, new.observation) %>%
    unnest(c(pred, new.observation)) -> datd

g + geom_point(data=datd, aes(x=pred, y=observation), color='black', size=2)


This topic was automatically closed 7 days after the last reply. New replies are no longer allowed.

If you have a query related to it or one of the replies, start a new topic and refer back with a link.