On one hand, I managed to plot something with this code:
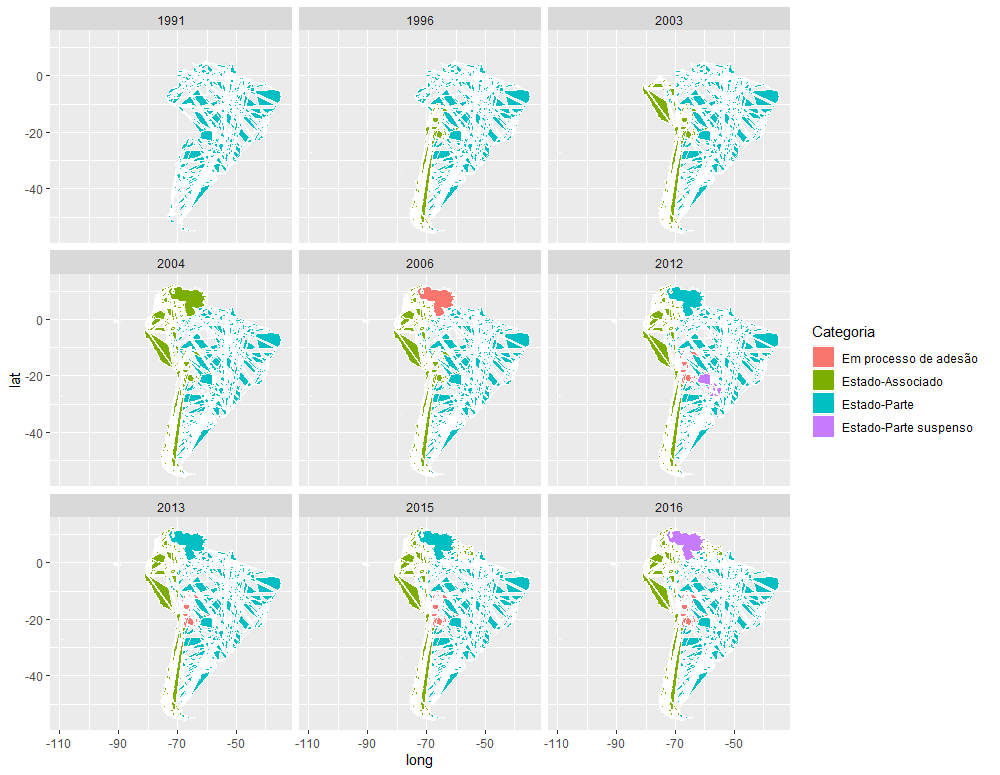
ggplot(MSRmap, aes(long, lat, group = group))+
  geom_polygon(aes(fill = Categoria), color = "white")+
  facet_wrap(~Ano)
However, it gives these maps that don't show much. Only one country has the proper shape, while the others are crossed by white lines
Reproducible example:
data <- data.frame(
  stringsAsFactors = FALSE,
         Categoria = c("Estado-Parte","Estado-Parte",
                       "Estado-Parte","Estado-Parte","Estado-Parte",
                       "Estado-Associado","Estado-Parte","Estado-Associado",
                       "Estado-Parte","Estado-Parte"),
               Ano = c(1991,1991,1991,1991,1996,
                       1996,1996,1996,1996,1996),
            region = c("Argentina","Brazil",
                       "Paraguay","Uruguay","Argentina","Bolivia","Brazil","Chile",
                       "Paraguay","Uruguay")
)

world <- map_data("world")

MSRmap <- merge (world, data)