Hello,
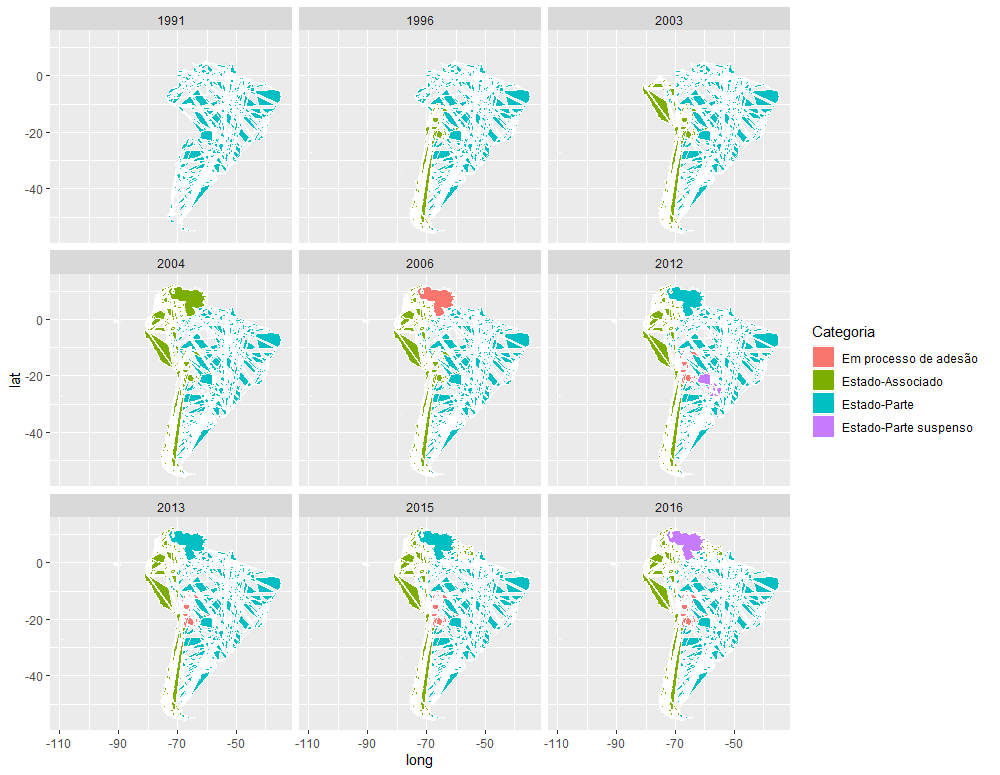
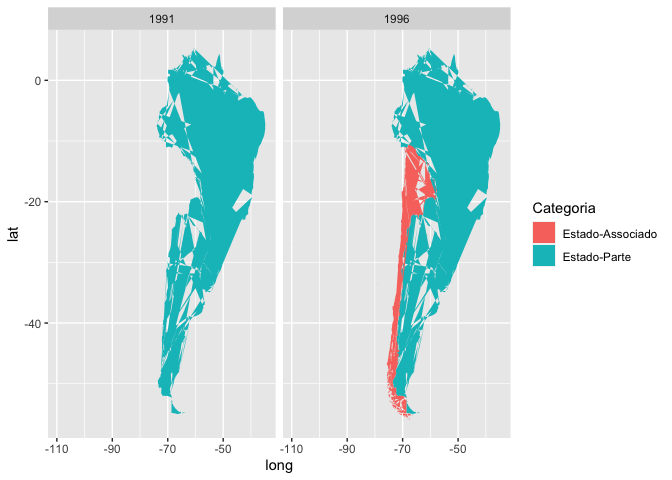
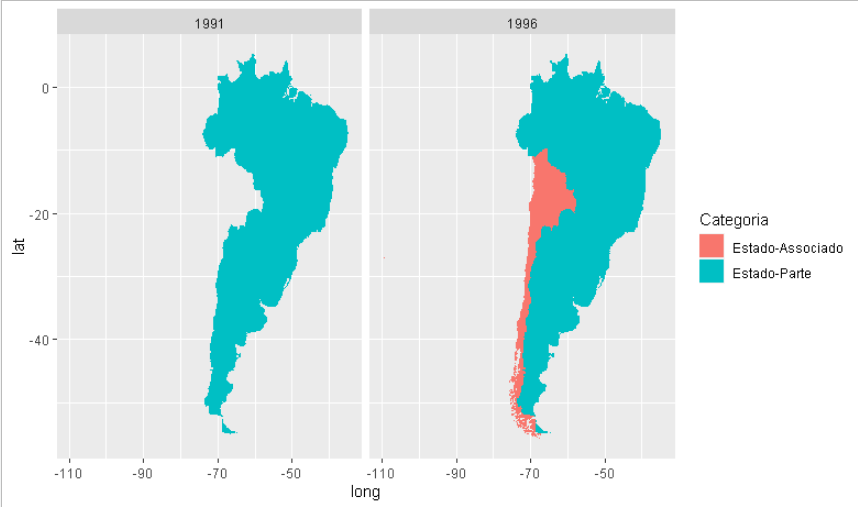
I'm trying to use ggplot2 and facet_wrap to show the evolution of membership in Mercosur. My goal is to have each facet depicting a year (1991, 1996...) and which were the countries member of the trade bloc, with a different colour to indicate if they were full members or associated members.
The countries that were part of the bloc in that year are listed in "region", while the year is "Ano" and their status is in "Categoria"
When I run the following code I receive: Error: stat_sf requires the following missing aesthetics: geometry
ggplot(data = world) +
  geom_sf() +
  geom_sf(colour = "black") +
  geom_sf(data = MSRmap, aes(fill = Categoria)) +
  coord_sf(xlim = c(-90, -30), ylim = c(-60, 15), expand = FALSE) +
  facet_wrap(~Ano) +
  theme_minimal() +
  labs(fill = "Categoria",
       x = "",
       y = "")
The reprex is (I'm not sure if you need all the data from all the countries)
MSRmap <- data.frame(
  stringsAsFactors = FALSE,
            region = c("Argentina","Argentina",
                       "Argentina","Argentina","Argentina"),
              long = c(-68.66162109375,
                       -68.66162109375,-68.66162109375,-68.66162109375,-68.66162109375),
               lat = c(-49.9357414245605,
                       -49.9357414245605,-49.9357414245605,-49.9357414245605,
                       -49.9357414245605),
             group = c(20, 20, 20, 20, 20),
             order = c(1686L, 1686L, 1686L, 1686L, 1686L),
         Categoria = c("Estado-Parte","Estado-Parte",
                       "Estado-Parte","Estado-Parte","Estado-Parte"),
               Ano = c(2003, 1996, 2015, 2006, 2016)
)

world <- map_data("world")
I appreciate your help in advance!