aliman
April 19, 2020, 6:49pm
1
Hello I have a list of individuals with 2 columns denoting a set of cities each.
I want to graph in a nice way the movement patterns between column1 and column 2.
FJCC
April 19, 2020, 7:13pm
2
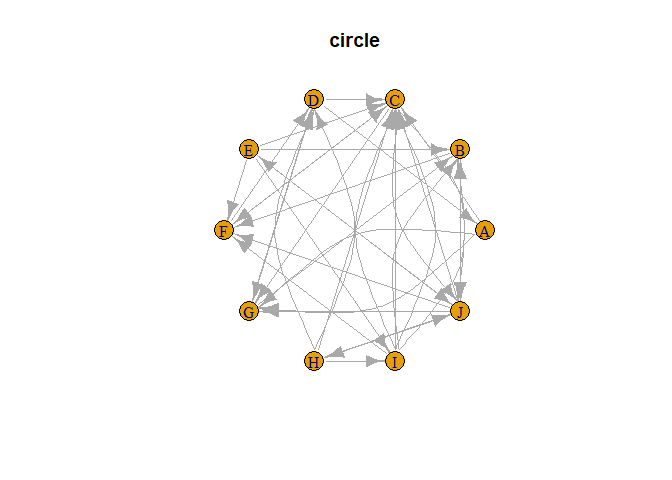
Maybe something from the igraph package will work for you. There are examples here.
DF <- data.frame(Indiv = sample(1:10, 40, replace = TRUE),
                 From = sample(LETTERS[1:10], 40, replace = TRUE),
                 To = sample(LETTERS[1:10], 40, replace = TRUE))
DF <- DF[DF$From != DF$To, ]
Tbl <- table(DF$From, DF$To)
Tbl
#>
#>     A B C D E F G H I J
#>   A 0 0 1 0 0 0 2 0 0 0
#>   B 0 0 0 0 0 1 0 0 0 1
#>   C 0 0 0 0 0 1 1 0 0 2
#>   D 1 0 1 0 0 0 1 0 0 0
#>   E 0 1 1 0 0 1 0 0 1 1
#>   F 0 0 1 1 0 0 0 0 0 0
#>   G 0 1 0 1 0 0 0 0 0 0
#>   H 0 0 1 2 0 0 0 0 1 1
#>   I 0 2 3 0 0 1 0 0 0 0
#>   J 0 1 1 0 1 1 1 1 0 0
library(igraph)

Network <- graph_from_adjacency_matrix(Tbl , mode='directed' )
plot(Network, layout=layout.circle, main="circle")
Created on 2020-04-19 by the reprex package (v0.3.0)
aliman
April 19, 2020, 7:39pm
3
thank you, i will try it. also looking into chord diagrams from the circlize package.
system
May 10, 2020, 7:39pm
4
This topic was automatically closed 21 days after the last reply. New replies are no longer allowed.