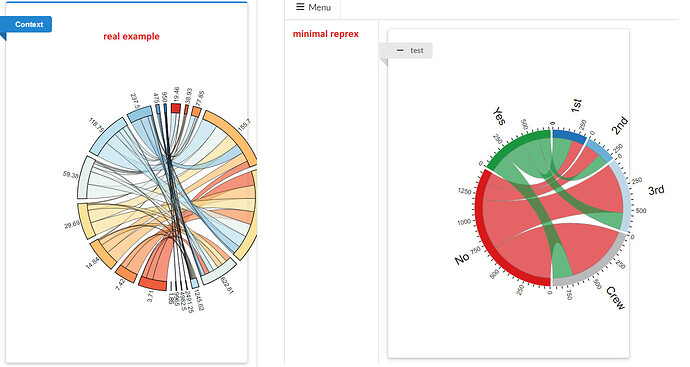
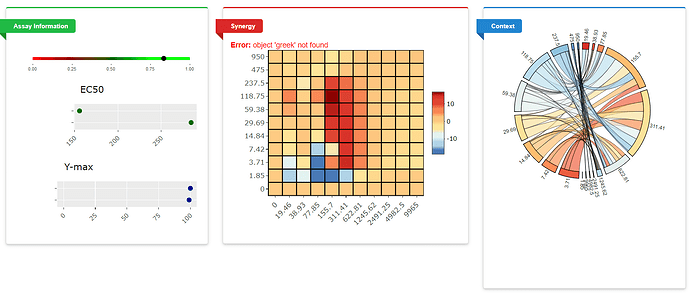
I've got a Shiny dashboard which uses some HTML to have the entire window fixed (aka the boxes/plots will not stretch when you maximize the browser window). This works fine for all my ggplots, but not for my chord diagram, which I think is an htmlwidget.
Here's a screen shot from my app, and one from the minimal reprex I've produced below to illustrate the problem:
How can I manually position my plot to fit inside the box? I need to keep the size of the plot, as simply re-sizing will not work - it just makes the plot much too small.
library(shiny)
library(shiny.semantic)
library(semantic.dashboard)
library(chorddiag)
library(dplyr)

#First we just generate a matrix to be used for our plot (this just comes straight from chorddiag's vignette example)
titanic_tbl <- tibble::as_tibble(Titanic)
titanic_tbl <- titanic_tbl %>%
  mutate(across(where(is.character), as.factor))
  by_class_survival <- titanic_tbl %>%
  group_by(Class, Survived) %>%
  summarise(Count = sum(n)) %>%
  ungroup()
titanic.mat <- matrix(by_class_survival$Count, nrow = 4, ncol = 2, byrow = TRUE)
dimnames(titanic.mat ) <- list(Class = levels(titanic_tbl$Class),
                               Survival = levels(titanic_tbl$Survived))
groupColors <- c("#2171b5", "#6baed6", "#bdd7e7", "#bababa", "#d7191c", "#1a9641")


#Make ui
ui <- dashboardPage(
      dashboardHeader(),
      dashboardSidebar(sidebarMenu()),
      dashboardBody(

        #This will dictate the app's window size (rather than have it stretch to browser width)
        tags$head(
          tags$style(
            "body{
             height: 1500px;
             max-width: 1500px;
             min-width: 1500px;
             margin: auto;
              overflow-x:scroll;}" #Allow horizontal scroll
          )
        ),

      fluidRow(
      box(title = "test",
          title_side = "top left",
          width = 5,
          column(6,
                 chorddiagOutput("chordtest", height="450px", width="500px")) ))))


#Make server
server <- function(input, output) {

          output$chordtest <- renderChorddiag({
          chorddiag(titanic.mat, type = "bipartite",
                    groupColors = groupColors,
                    tickInterval = 50, categoryNames = c("",""))
  })}

#Run app
shinyApp(ui, server)

