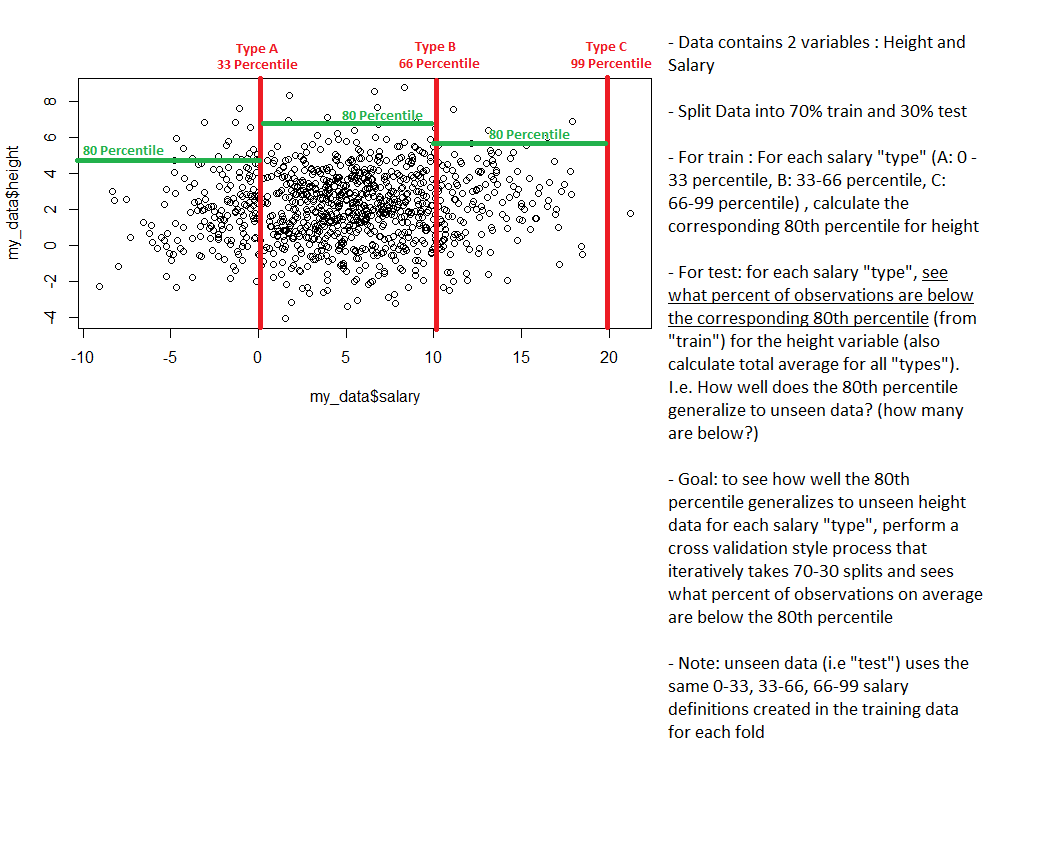
I am working with the R programming language. In this problem, I want to check how well the 80th percentile (for each group) within a training sample generalizes to unseen test data. Basically, I am trying to manually re-create the "k-fold cross validation" (Cross-validation (statistics) - Wikipedia procedure where instead of a classical predictive model, the model in this case is just the 80th percentile.
I attempted to write some R code that corresponds to this procedure (note: assume that "my_data" is the true population):
#create data

library(dplyr)

set.seed(123)


salary <- rnorm(1000,5,5)
height <- rnorm(1000,2,2)
my_data = data.frame(salary, height)
plot(my_data$salary, my_data$height)


results <- list()
for (i in 1:100) {
  train_i<-sample_frac(my_data, 0.7)
  sid<-as.numeric(rownames(train_i))
  test_i<-my_data[-sid,]

  salary_quantiles = data.frame( train_i %>% summarise (quant_1 = quantile(salary, 0.33),
                                                        quant_2 = quantile(salary, 0.66),
                                                        quant_3 = quantile(salary, 0.99)))

  train_i$salary_type = as.factor(ifelse(train_i$salary < salary_quantiles$quant_1 , "A", ifelse( train_i$salary  >  salary_quantiles$quant_1  & train_i$salary < salary_quantiles$quant_2, "B", "C")))

  height_quantiles = data.frame( train_i %>%  group_by(salary_type)  %>%  summarise(quant_80 = quantile(height, 0.80)))
  test_i$salary_type = as.factor(ifelse(test_i$salary < salary_quantiles$quant_1 , "A", ifelse( test_i$salary  >  salary_quantiles$quant_1  & test_i$salary < salary_quantiles$quant_2, "B", "C")))
  test_i$height_pred <- height_quantiles$quant_80[match(test_i$salary_type, height_quantiles$salary_type)]
  test_i$accuracy = ifelse(test_i$height_pred > test_i$height, 1, 0)


  results_tmp = data.frame(test_i %>%
                           group_by(salary_type) %>%
                           dplyr::summarize(Mean = mean(accuracy, na.rm=TRUE)))

  results_tmp$iteration = i

  results_tmp$total_mean = mean(test_i$accuracy)
  results[[i]] <- results_tmp
}
results

#view results
results_df <- do.call(rbind.data.frame, results)

#overall performance
mean(results_df$total_mean)

0.76533
The above R code appears to work. In this example, it would appear that the 76.5 % of time, unseen observations are below the 80% percentile mark generated from the training data. Thus, I can re-do this analysis on the whole data :
 salary_quantiles = data.frame( my_data %>% summarise (quant_1 = quantile(salary, 0.33),
                                                        quant_2 = quantile(salary, 0.66),
                                                        quant_3 = quantile(salary, 0.99)))

salary_quantiles
   quant_1  quant_2  quant_3
1 3.005188 6.952076 16.98823


      my_data$salary_type = as.factor(ifelse(my_data$salary < salary_quantiles$quant_1 , "A", ifelse( my_data$salary  >  salary_quantiles$quant_1  & my_data$salary < salary_quantiles$quant_2, "B", "C")))

      height_quantiles = data.frame( my_data %>%  group_by(salary_type)  %>%  summarise(quant_80 = quantile(height, 0.80)))

> height_quantiles
  salary_type quant_80
1           A 3.743133
2           B 3.773208
3           C 3.906956
Now, I can reasonably conclude that if:
- Salary between (0, 3.005188) then approximately 80% of heights will be below 3.743 (for unseen data similar to "my_data")
- Salary between (3.005188, 6.9520760) then approximately 80% of heights will be below 3.773208 (for unseen data similar to "my_data")
- Salary between (6.952076 16.98823) then approximately 80% of heights will be below 3.906956 (for unseen data similar to "my_data")
Question : Can someone please tell me if the R code I have indeed corresponds to the "K Fold Cross Validation" process ? Is this correct?
