I have run an Mann Kendall test on lake water level using R. The results for the tau is: -0.0068 and the p value is 0.29565. What do these results mean? Secondly, I did an autocorrelation for the lake level time series (attached graph), may you kind assist with interpretation.
I don't know anything about the Mann Kendall test.
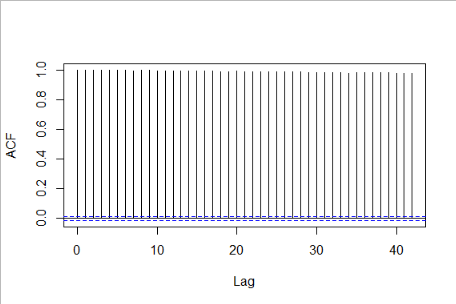
The ACF plot seems to show that there is an extremely high degree of autocorrelation up to lag 40. Perhaps your time series period is much smaller than the time scale of variation in lake level. You might try plotting for lags up to 200 (or some number much higher than 40).