Hey,
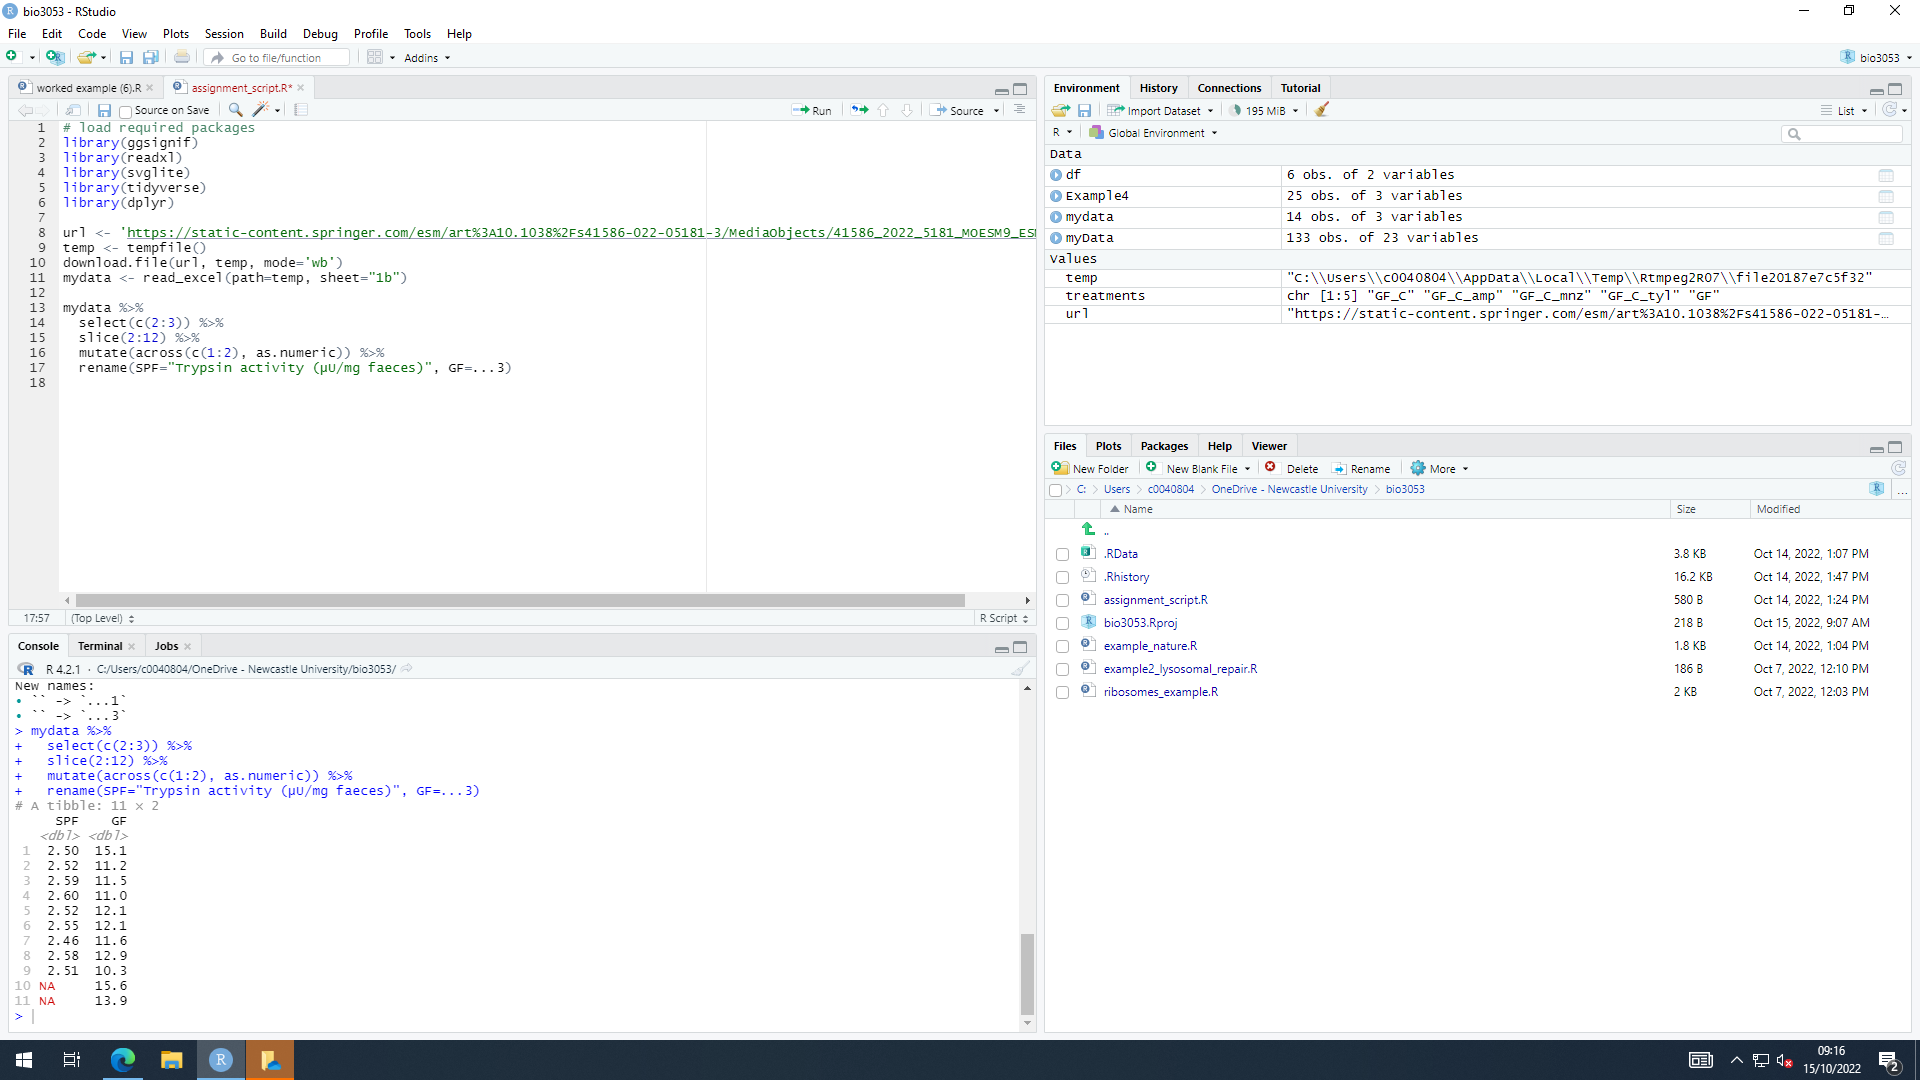
I would like to create a bar plot using the following data, I have been using the pipe too but cannot get the data into a format suitable to plot (activity vs category for the categories SPF and GF).
Any help would be much appreciated!
T
Hey,
I would like to create a bar plot using the following data, I have been using the pipe too but cannot get the data into a format suitable to plot (activity vs category for the categories SPF and GF).
Any help would be much appreciated!
T
The image you posted is illegible to me. Please post enough rows of your data for an example plot to be made. You can get output that represents the first 30 rows of data by running
dput(head(DF, 30))
That assumes your data are in a data frame named DF. Paste the output into a reply and place a line with three back ticks just before and after the output, like this
```
Pasted output
```
Please do not post screenshots, it is considered a bad practice here, post formatted code instead, here is how to do it:
Also, to help us help you, could you please prepare a reproducible example (reprex) illustrating your issue? Please have a look at this guide, to see how to create one:
This topic was automatically closed 42 days after the last reply. New replies are no longer allowed.
If you have a query related to it or one of the replies, start a new topic and refer back with a link.