hello I am trying to make a histogram where years is on the X axis and Y is the number of counts for those years. I am trying to do this with the following code:
ggplot(data = BOOKIII_121, aes(x = years, y = animal_numbers)) + geom_bar(stat = "identity")
I am so confused how to make this histogram without geom_histogram. I really dont know why the graph is not showing up. It just shows an empty graph that does not look like anything. any advice is helpful thank U:(<3
I am so dumb I made a mistake in typing my code out but it still doesnt work. but also the thing is I don't want the x axis as a factor I want it as a histogram like a continuous variable. thank u D:. when I change it to a factor as you did in the ggplot it works.
Can you be more specific?, what do you mean by "it doesn't work"?, ideally, could you please prepare a reproducible example (reprex) illustrating your issue? Please have a look at this guide, to see how to create one:
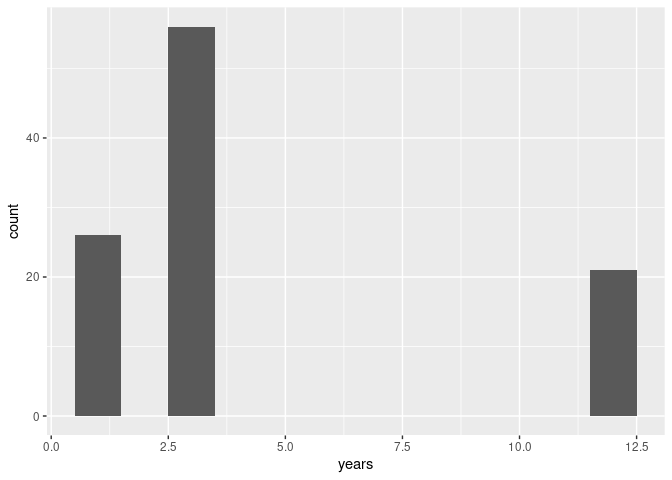
Well, in your iriginal code you are using geom_bar() with a continuous variable, this is not the expected use case for a barplot, so you get an odd result. If you want to make a proper histogram by using geom_bar() you would need to pre-calculate bins (categories) as well. I think it would be simpler to uncount() your data and use geom_histogram() to calculate the bins for you.