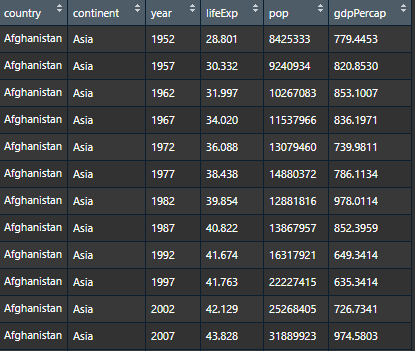
Using the above code from a ggplot tutorial found online, I obtain a df using data from the gapminder package. It looks like this :
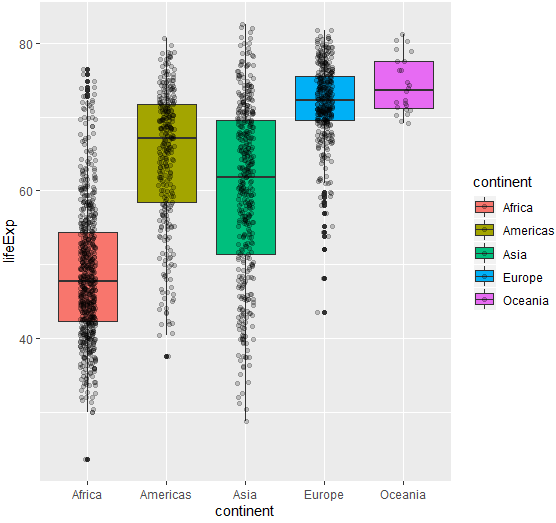
and the resulting plot works too :
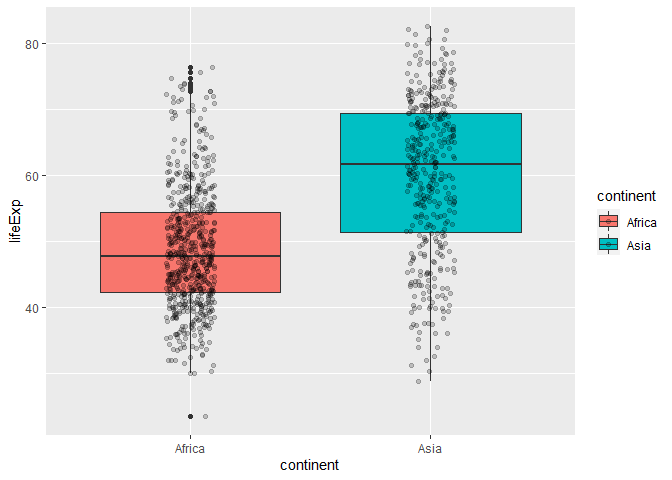
The dplyr package has the filter function for just this purpose.
library(gapminder)
library(ggplot2)
library(dplyr)
#>
#> Attaching package: 'dplyr'
#> The following objects are masked from 'package:stats':
#>
#>     filter, lag
#> The following objects are masked from 'package:base':
#>
#>     intersect, setdiff, setequal, union
gapminder <- as.data.frame(gapminder)
gapminder %>%
  filter(continent %in% c("Africa", "Asia")) %>%
  ggplot(aes(x=continent,y=lifeExp, fill=continent)) +
  geom_boxplot() + geom_jitter(width=0.1,alpha=0.2)