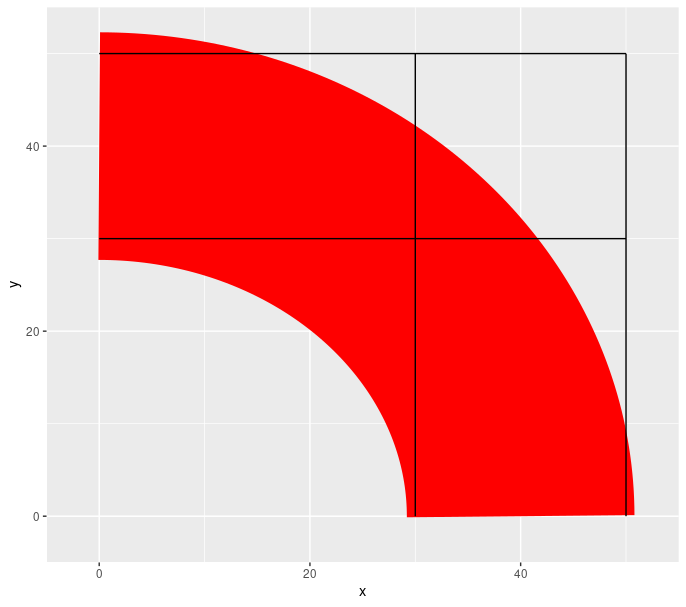
I need to make a width red quarter circle using ggplot2.
It is not the same width for the whole arc. Strange.
I would rather use pure ggplot2()
library(ggforce)
library(ggplot2)

l1 <- data.frame(x = c(0,50), y = c(30,30))
l2 <- data.frame(x = c(0,50), y = c(50,50))
l3 <- data.frame(x = c(30,30), y = c(0,50))
l4 <- data.frame(x = c(50,50), y = c(0,50))
a1 <- data.frame(x0 = 0, y0 = 0, r0 = 0, r = 40, angle = c(0, pi/2))

g <- ggplot()
g <- g + geom_arc2(data = a1, size = 80, color = "red",
                   aes(x0 = 0, y0 = 0, r = r, end = angle))
g <- g + geom_path(data = l1, aes(x,y))
g <- g + geom_path(data = l2, aes(x,y))
g <- g + geom_path(data = l3, aes(x,y))
g <- g + geom_path(data = l4, aes(x,y))
g <- g + coord_cartesian(expand = FALSE, xlim = c(-5, 55), ylim = c(-5, 55))
g
Have you tried using geom_curve ?
mara
April 3, 2021, 4:49pm
3
If you expect it to be the same width throughout and it's not, then you might open an issue in ggforce . (I see you already did so, and I'm adding the link here so that anyone seeing this in the future can follow along.)
opened 10:59PM - 02 Apr 21 UTC
closed 02:12PM - 31 Aug 22 UTC
I am trying to make a large red quarter circle using the code below.
I want t… he circle to have a width of 20.
1. Does the size parameter work correctly? Is size and width the same?
2. I expects the width same for the whole arc. It looks like it is wider to the left than to the bottom.

```
library(ggforce)
library(ggplot2)
l1 <- data.frame(x = c(0,50), y = c(30,30))
l2 <- data.frame(x = c(0,50), y = c(50,50))
l3 <- data.frame(x = c(30,30), y = c(0,50))
l4 <- data.frame(x = c(50,50), y = c(0,50))
a1 <- data.frame(x0 = 0, y0 = 0, r0 = 0, r = 40, angle = c(0, pi/2))
g <- ggplot()
g <- g + geom_arc2(data = a1, size = 80, color = "red",
aes(x0 = 0, y0 = 0, r = r, end = angle))
g <- g + geom_path(data = l1, aes(x,y))
g <- g + geom_path(data = l2, aes(x,y))
g <- g + geom_path(data = l3, aes(x,y))
g <- g + geom_path(data = l4, aes(x,y))
g <- g + coord_cartesian(expand = FALSE, xlim = c(-5, 55), ylim = c(-5, 55))
g
```
I could be wrong here, but: Thomas, the author of ggforce, is also one of the maintainers of ggplot2, which is to say that I'm guessing he wouldn't have added it to ggforce if it was already a geom in ggplot.Extending ggplot2 for details), which is what Thomas is doing in ggforce.
#' @include arc_bar.R
NULL

#' Arcs based on radius and radians
#'
#' This set of stats and geoms makes it possible to draw circle segments based
#' on a center point, a radius and a start and end angle (in radians). These
#' functions are intended for cartesian coordinate systems and makes it possible
#' to create circular plot types without using the
#' [ggplot2::coord_polar()] coordinate system.
#'
#' @details An arc is a segment of a line describing a circle. It is the
#' fundamental visual element in donut charts where the length of the segment
#' (and conversely the angular span of the segment) describes the proportion of
#' an entety.
#'
#' @section Aesthetics:
#' geom_arc understand the following aesthetics (required aesthetics are in
#' bold):
#'
show original
1 Like
system
April 24, 2021, 4:49pm
4
This topic was automatically closed 21 days after the last reply. New replies are no longer allowed.