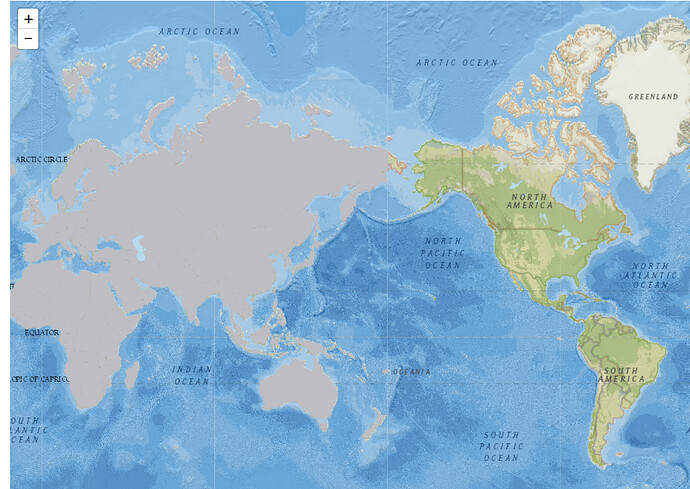
Make Shiny leaflet map less cumbersome, faster

Cannot fix my problem for MULTIPLE filters/polygons. Currently my code works, but very slow, I do not use observe(), reactive(), and LeafletProxy(), because I stumbled.

I obviously checked this SO answer Changing Leaflet map according to input without redrawing and this one Making Shiny UI Adjustments Without Redrawing Leaflet Maps and leaflet tutorial Using Leaflet with Shiny.

In my case I have four filters and do not quite understand how to combine them together and make the map fast.

My sample data:

Country Client  Channel Status
Country 1   Client 1    Agent network   Launched
Country 2   Client 2    Debit cards Launched
Country 3   Client 3    M-banking   Planning
Country 4   Client 4    M-banking   Launched
Country 5   Client 5    Agent network   Launched
Country 6   Client 6    Agent network   Launched
Country 7   Client 7    Agent network   Pilot

This code works, but slowly, the map is heavy, it causes shadow on a leaflet map

# Packages
library(shiny)
library(shinythemes)
library(leaflet)
library(rgdal)

# Set working directory
setwd("C: /My Shiny apps")

# Read csv, which was created specifically for this app
projects <- read.csv("sample data10.csv", header = TRUE) 

# Read a shapefile
countries <- readOGR(".","ne_50m_admin_0_countries")

# Merge data
projects.df <- merge(countries, projects, by.x = "name", by.y = "Country")
class(projects.df)


# Shiny code

# UI

ui <- fluidPage(theme = shinytheme("united"),
        titlePanel("Map sample)"), 
        sidebarLayout(
          sidebarPanel(
            selectInput("countryInput", "Country",
                        choices = c("Choose country", "Country 1",
                                    "Country 2",
                                    "Country 3",
                                    "Country 4",
                                    "Country 5",
                                    "Country 6", 
                                    "Country 7"),
                        selected = "Choose country"),
            selectInput("clientInput", " Client",
                        choices = c("Choose Client", "Client 1",
                                    "Client 2",
                                    "Client 3",
                                    "Client 4",
                                    "Client 5",
                                    "Client 6"),
                        selected = "Choose Client"),
            selectInput("channeInput", "Channel",
                        choices = c("Choose Channel", "Agent network", 
"M-banking", "Debit cards"),
                        selected = "Choose Channel"),
            selectInput("statusInput", "Status",
                        choices = c("Choose status", "Launched", 
"Pilot", "Planning"),
                        selected = "Choose status")
          ),

          mainPanel(leafletOutput(outputId = 'map', height = 800) 
          )
        )
)

# Server 
server <- function(input, output) {

output$map <- renderLeaflet({

pal1 <- colorFactor(
palette = "Red",
domain = input$countryInput)

pal2 <- colorFactor(
palette = "Yellow",
domain = input$clientInput)

pal3 <- colorFactor(
palette = "Green",
domain = input$channelInput)

pal4 <- colorFactor(
palette = "Blue",
domain = input$statusInput)

# Create a pop-up
state_popup <- paste0("<strong>Country: </strong>", 
                  projects.df$name, 
                  "<br><strong> Client: </strong>", 
                  projects.df$ Client,
                  "<br><strong> Channel: </strong>", 
                  projects.df$Channel
                  "<br><strong>Status: </strong>", 
                  projects.df$Status)

# Create a map

projects.map <- projects.df %>%
leaflet() %>%
addTiles("Stamen.Watercolor") %>% 
setView(11.0670977,0.912484, zoom = 4) %>% 
addPolygons(fillColor = ~pal1(projects.df$name), 
          popup = state_popup,
          color = "#BDBDC3",
          fillOpacity = 1,
          weight = 1) %>%
 addPolygons(fillColor = ~pal2(projects.df$Client), 
          popup = state_popup,
          color = "#BDBDC3",
          opacity = 1,
          weight = 1) %>%
 addPolygons(fillColor = ~pal3(projects.df$Channel), 
          popup = state_popup,
          color = "#BDBDC3",
          opacity = 1,
          weight = 1) %>%
 addPolygons(fillColor = ~pal4(projects.df$Status), 
          popup = state_popup,
          color = "#BDBDC3",
          opacity = 1,
          weight = 1)
 })

}

shinyApp(ui = ui, server = server)

So, my map is very heavy, a shadow appears on territory (not on water part). Cumbersome.
But the main problem I tried many options with reactive, observe, leafletProxy and failed.

Please help. May the force be with you!

Try rgeos::gSimplify on your spatial data, it sounds to me like it is too large for the browser. Experiment with gSimplify tolerance levels until you find a good balance between speed and detail.

2 Likes

You might find rmapshaper::ms_simplify works better than rgeos::gSimplify for simplifying polyons - it uses a different algorithm to create smoother borders, and more importantly preserves topology (shared boundaries) between adjacent polygons so you don't get gaps and overlaps between your countries.

(Disclaimer: I am the author of the rmapshaper package)

Cheers,
Andy

9 Likes

This is an advice from another person

There are a couple things you can do to set up your code to handle reactivity.

First, make sure your output$map variable is your minimum viable map -- it should load the basemap, set the lat/lon, set the zoom, and that's about it. So it might look like:

output$map <- renderLeaflet({
leaflet('map') %>%
addTiles("Stamen.Watercolor") %>% 
setView(11.0670977,0.912484, zoom = 4)
})

Then you can create a different output for each of your polygons using renderPlot and wrap it in a conditional statement:

output$country_one <- renderPlot({
if("Country 1" %in% input$"countryInput") {
leafletProxy('map') %>%
addPolygons(data = projects.df, fillColor = ~pal1(projects.df$name), 
          popup = paste0("<strong>Country: </strong>", 
                  projects.df$name, 
                  "<br><strong> Client: </strong>", 
                  projects.df$ Client,
                  "<br><strong> Channel: </strong>", 
                  projects.df$Channel
                  "<br><strong>Status: </strong>", 
                  projects.df$Status),
          color = "#BDBDC3",
          fillOpacity = 1,
          weight = 1)
}
)}

Then in your UI section, you call each output one after another:

leafletProxy('map')
plotOutput('country_one')
1 Like

Thanks all, but still struggling. Any ideas how to write the code are super appreciated. I spent 1 week on this primitive app already :frowning:

If you want more concrete help, I'd strongly suggest making a reprex - read https://www.tidyverse.org/help/ for some tips.

2 Likes

So, the code was rewritten differently

# Packages
library(shiny)
library(shinythemes)
library(leaflet)
library(rgdal)

# Set working directory
setwd("C: /My Shiny apps")

# Read csv, which was created specifically for this app
projects <- read.csv("sample data10.csv", header = TRUE) 

# Read a shapefile
countries <- readOGR(".","ne_50m_admin_0_countries")

# Merge data
projects.df <- merge(countries, projects, by.x = "name", by.y = "Country")
class(projects.df)

# Shiny code

# UI

ui <- fluidPage(theme = shinytheme("united"),
        titlePanel("Map sample"), 
        sidebarLayout(
          sidebarPanel(
            selectInput("countryInput", "Country",
                        choices = c("Choose country", "Country 1","Country 2","Country 3","Country 
 4","Country 5","Country 6", "Country 7"),
                        selected = "Choose country"),
            selectInput("clientInput", " Client",
                        choices = c("Choose Client", "Client 1","Client 2","Client 3","Client 4","Client 
 5","Client 6"),
                        selected = "Choose Client"),
            selectInput("channeInput", "Channel",
                        choices = c("Choose Channel", "Agent network", "M-banking", "Debit cards"),
                        selected = "Choose Channel"),
            selectInput("statusInput", "Status",
                        choices = c("Choose status", "Launched", "Pilot", "Planning"),
                        selected = "Choose status")
          ),

          mainPanel(
            leafletOutput('map'), 
            plotOutput('country_output'),
            plotOutput('client_output'),
            plotOutput('channel_output'),
            plotOutput('status_output')
          )
        )
)

 server <- function(input, output) {

 pal1 <- colorFactor(palette = "Blues", domain = c(0, 100))
 pal2 <- colorFactor(palette = "Blues", domain = c(0, 100))
 pal3 <- colorFactor(palette = "Blues", domain = c(0, 100))
 pal4 <- colorFactor(palette = "Blues", domain = c(0, 100))

 output$map <- renderLeaflet({
 leaflet('map') %>%
  addTiles("Stamen.Watercolor") %>% 
  setView(11.0670977,0.912484, zoom = 4)
 })

 output$country_output <- renderPlot({
 if("Country 1" %in% input$"countryInput") { # sample conditional statement
 leafletProxy('map') %>% # initalize the map
  clearGroup("polys") %>% # clear any previous polygons
  addPolygons(fillColor = ~pal1(projects.df$name), 
              popup = paste0("<strong>Country: </strong>",projects.df$name,"<br><strong> Client: 
 </strong>",projects.df$ Client,"<br><strong> Channel: </strong>",projects.df$Channel,"<br>
 <strong>Status: </strong>", projects.df$Status), 
              color = "#BDBDC3", fillOpacity = 1, weight = 1, group = "polys")
 }
 })

output$client_output <- renderPlot({
leafletProxy('map') %>% # initalize the map
clearGroup("polys") %>% # clear any previous polygons
addPolygons(fillColor = ~pal2(projects.df$Client), 
            popup = paste0("<strong>Country: </strong>",projects.df$name,"<br><strong> Client: 
</strong>",projects.df$ Client,"<br><strong> Channel: </strong>",projects.df$Channel,"<br>
<strong>Status: </strong>", projects.df$Status), 
            color = "#BDBDC3", fillOpacity = 1, weight = 1, group = "polys")
})  

output$channel_output <- renderPlot({
leafletProxy('map') %>% # initalize the map
clearGroup("polys") %>% # clear any previous polygons
addPolygons(fillColor = ~pal3(projects.df$Channel), 
            popup = paste0("<strong>Country: </strong>",projects.df$name,"<br><strong> Client: 
</strong>",projects.df$ Client,"<br><strong> Channel: </strong>",projects.df$Channel,"<br>
<strong>Status: </strong>", projects.df$Status), 
            color = "#BDBDC3", fillOpacity = 1, weight = 1, group = "polys")
 })    

 output$status_output <- renderPlot({
 leafletProxy('map') %>% # initalize the map
 clearGroup("polys") %>% # clear any previous polygons
 addPolygons(fillColor = ~pal4(projects.df$Status), 
            popup = paste0("<strong>Country: </strong>",projects.df$name,"<br><strong> Client: 
 </strong>",projects.df$ Client,"<br><strong> Channel: </strong>",projects.df$Channel,"<br>
 <strong>Status: </strong>", projects.df$Status), 
            color = "#BDBDC3", fillOpacity = 1, weight = 1, group = "polys")
 })      

 }

shinyApp(ui = ui, server = server)

However, problems with the map remain the same, even filters stop to work now :frowning:

You are much more likely to get help if you help us help you by making a reprex. If you're lucky someone from the community will pitch in and help you make one, but I'd strongly recommend starting the process yourself.

1 Like

Thanks, I will try, of course :slight_smile:

One thing that I might do to speed up your code is to merge the data with the shapefile and then save the object as an .rda file. In the shiny app, just load the .rda file. I've found that readOGR sometimes is pretty slow.

@rkahne, thank you for your comment, but do you think it may be a problem for data with 7 rows in cvs? Not sure :frowning:

Don't use renderPlot/plotOutput for leafletProxy. Instead, just use observe() on the server side and nothing in the UI. Please watch the Effective Reactive Programming tutorial here: https://www.rstudio.com/resources/webinars/shiny-developer-conference/

5 Likes

I didn't realize these talks were online! That's exciting!

@jcheng, thanks a lot! I did not try these ones. Plus I will try to provide my reprex soon.

I remember struggling with redrawing entire polygons instead of simply changing fill/stroke colors and transparency. Seems to me fill and stroke should be reactive.

1 Like

Is this the type of filtering behavior you want to implement? It's tough to understanding your objective without a reprex, but you might find the following helpful.

  • To avoid unnecessary updates to the map, take advantage of the fact that reactiveValues aren't invalidated unless their values change.
  • If your shapefile is slow to render, Mike Bostock's blog has an insightful series on toposimplify.
  • @jcheng's superzip code is a great reference.
2 Likes

Dear @nathania, thanks for your response! Still working on it, no reprex so far, will provide soon. I am checking conference videos, recommended by @jcheng.
My filtering is much easier, I would say. For example, by gender, country, city and something else.
Where I just use a sliderPanel for chosing options.
Something like this, but in Leaflet.


Thanks for idea about reactiveValues, hope to find it in video.
I will also read this blog.
Yes, superzip can be a good source, thanks for it, will check tomorrow, brain does not work anymore.

Sincerely
Oleksiy

1 Like

Resolved with the help of the awesome R community.
The perfect solution is here:


Thank you very much for your responses.

3 Likes