Hello,
I don't know if this is possible but I have a series of plots that I am plotting with grid.arrange from the gridExtra() package and I want to create a legend that is common to all of them so that I don't have multiple legends on the same page. I know how to do all of the above, except that my legend takes up half the page. Is there any way to reduce the size so that the legend only takes up the space that it needs to? Here is what it looks like now:
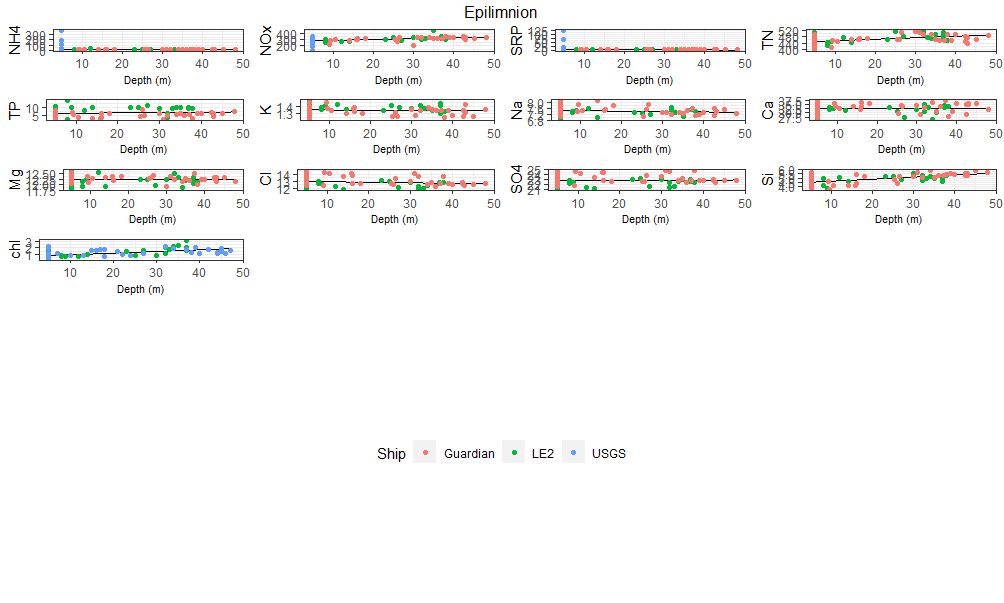
Ugh, it's hideous! I tried several didn't things, none of them worked. Any ideas would be much appreciated.
Here is my code:
target_cols <- colnames(d[,2:14])

episcat <- function(colname){
  p = ggplot(d) +
    aes(x=Depths, y = d[,colname], color=Ship) +
    geom_smooth(method="lm", se=F, color='black', size=0.7) +
    geom_point() +
    theme_bw() +
    labs(y=colname,
         x="Depth (m)") +
    theme(axis.title.x = element_text(size=8),
          legend.position = "none")
}

plot1_legend <- d %>%
  ggplot() +
  aes(x=Depths, y=NH4, color=Ship) +
  geom_point() +
  theme(legend.position = "bottom")

get_only_legend <- function(plot) {
  plot_table <- ggplot_gtable(ggplot_build(plot))
  legend_plot <- which(sapply(plot_table$grobs, function(x) x$name) == "guide-box")
  legend <- plot_table$grobs[[legend_plot]]
  return(legend)
}
# extract legend from plot1 using above function
legend <- get_only_legend(plot1_legend)

plots <- grid.arrange(grobs=map(target_cols, episcat), top="Epilimnion")

grid.arrange(plots, legend)
And here is a subset of my data (your resulting plots won't look like mine because it's not the whole dataset):
d <- structure(list(Ship = c("Guardian", "Guardian", "Guardian", "Guardian",
"Guardian", "LE2", "LE2", "LE2", "LE2", "LE2", "USGS", "USGS",
"USGS", "USGS", "USGS"), NH4 = c(8.79, 17.32, 8.12, 17.87, 9.22,
19.7, 14.4, 5.93, 10.1, 9.31, 11, NA, 7.25, NA, 371), NOx = c(320,
291, 320, 336, 307, 347, 338, 310, 443, 275, 356, NA, 284, NA,
272), SRP = c(2.4, 2.11, 2.5, 2.92, 2.51, 3.51, 3.65, 3.32, 3.92,
3.49, 68.4, NA, 4.94, NA, 123), TN = c(490, 461, 475, 505, 463,
509, 510, 453, 493, 453, NA, NA, NA, NA, NA), TP = c(5.03, 3.32,
2.65, 5.13, 2.9, 9.6, 10.2, 9.77, 9.8, 9.81, NA, NA, NA, NA,
NA), K = c(1.33, 1.31, 1.27, 1.26, 1.22, 1.36, 1.42, 1.48, 1.35,
1.46, NA, NA, NA, NA, NA), Na = c(8.11, 8.14, 7.87, 7.9, 7.21,
7.26, 7.25, 7.25, 7.05, 6.85, NA, NA, NA, NA, NA), Ca = c(33.87,
33.51, 33.72, 33.82, 33.65, 31.18, 30.69, 30.34, 30.41, 29.31,
NA, NA, NA, NA, NA), Mg = c(12.45, 12.31, 12.21, 12.44, 12.54,
12.21, 12.22, 12.15, 12.21, 11.93, NA, NA, NA, NA, NA), Cl = c(14.09,
13.62, 13.48, 13.44, 13.34, 13, 12.97, 13.01, 12.85, 12.63, NA,
NA, NA, NA, NA), SO4 = c(23.98, 23.57, 23.57, 23.84, 23.37, 22.83,
23.18, 23.01, 23, 22.67, NA, NA, NA, NA, NA), Si = c(4.58, 4.09,
3.94, 5.18, 4.52, 4.71, 5.14, 4.62, 4.92, 4, NA, NA, NA, NA,
NA), chl = c(NA, NA, NA, NA, NA, 0.63, 0.84, 0.81, 2.34, 1.09,
0.93, 1.75, 1.19, 1.11, 0.33)), class = c("grouped_df", "tbl_df",
"tbl", "data.frame"), row.names = c(NA, -15L), groups = structure(list(
    Ship = c("Guardian", "LE2", "USGS"), .rows = structure(list(
        1:5, 6:10, 11:15), ptype = integer(0), class = c("vctrs_list_of",
    "vctrs_vctr", "list"))), row.names = c(NA, -3L), class = c("tbl_df",
"tbl", "data.frame"), .drop = TRUE))
Thanks so much for your help!