Make columns from geom_col() the same width across output images

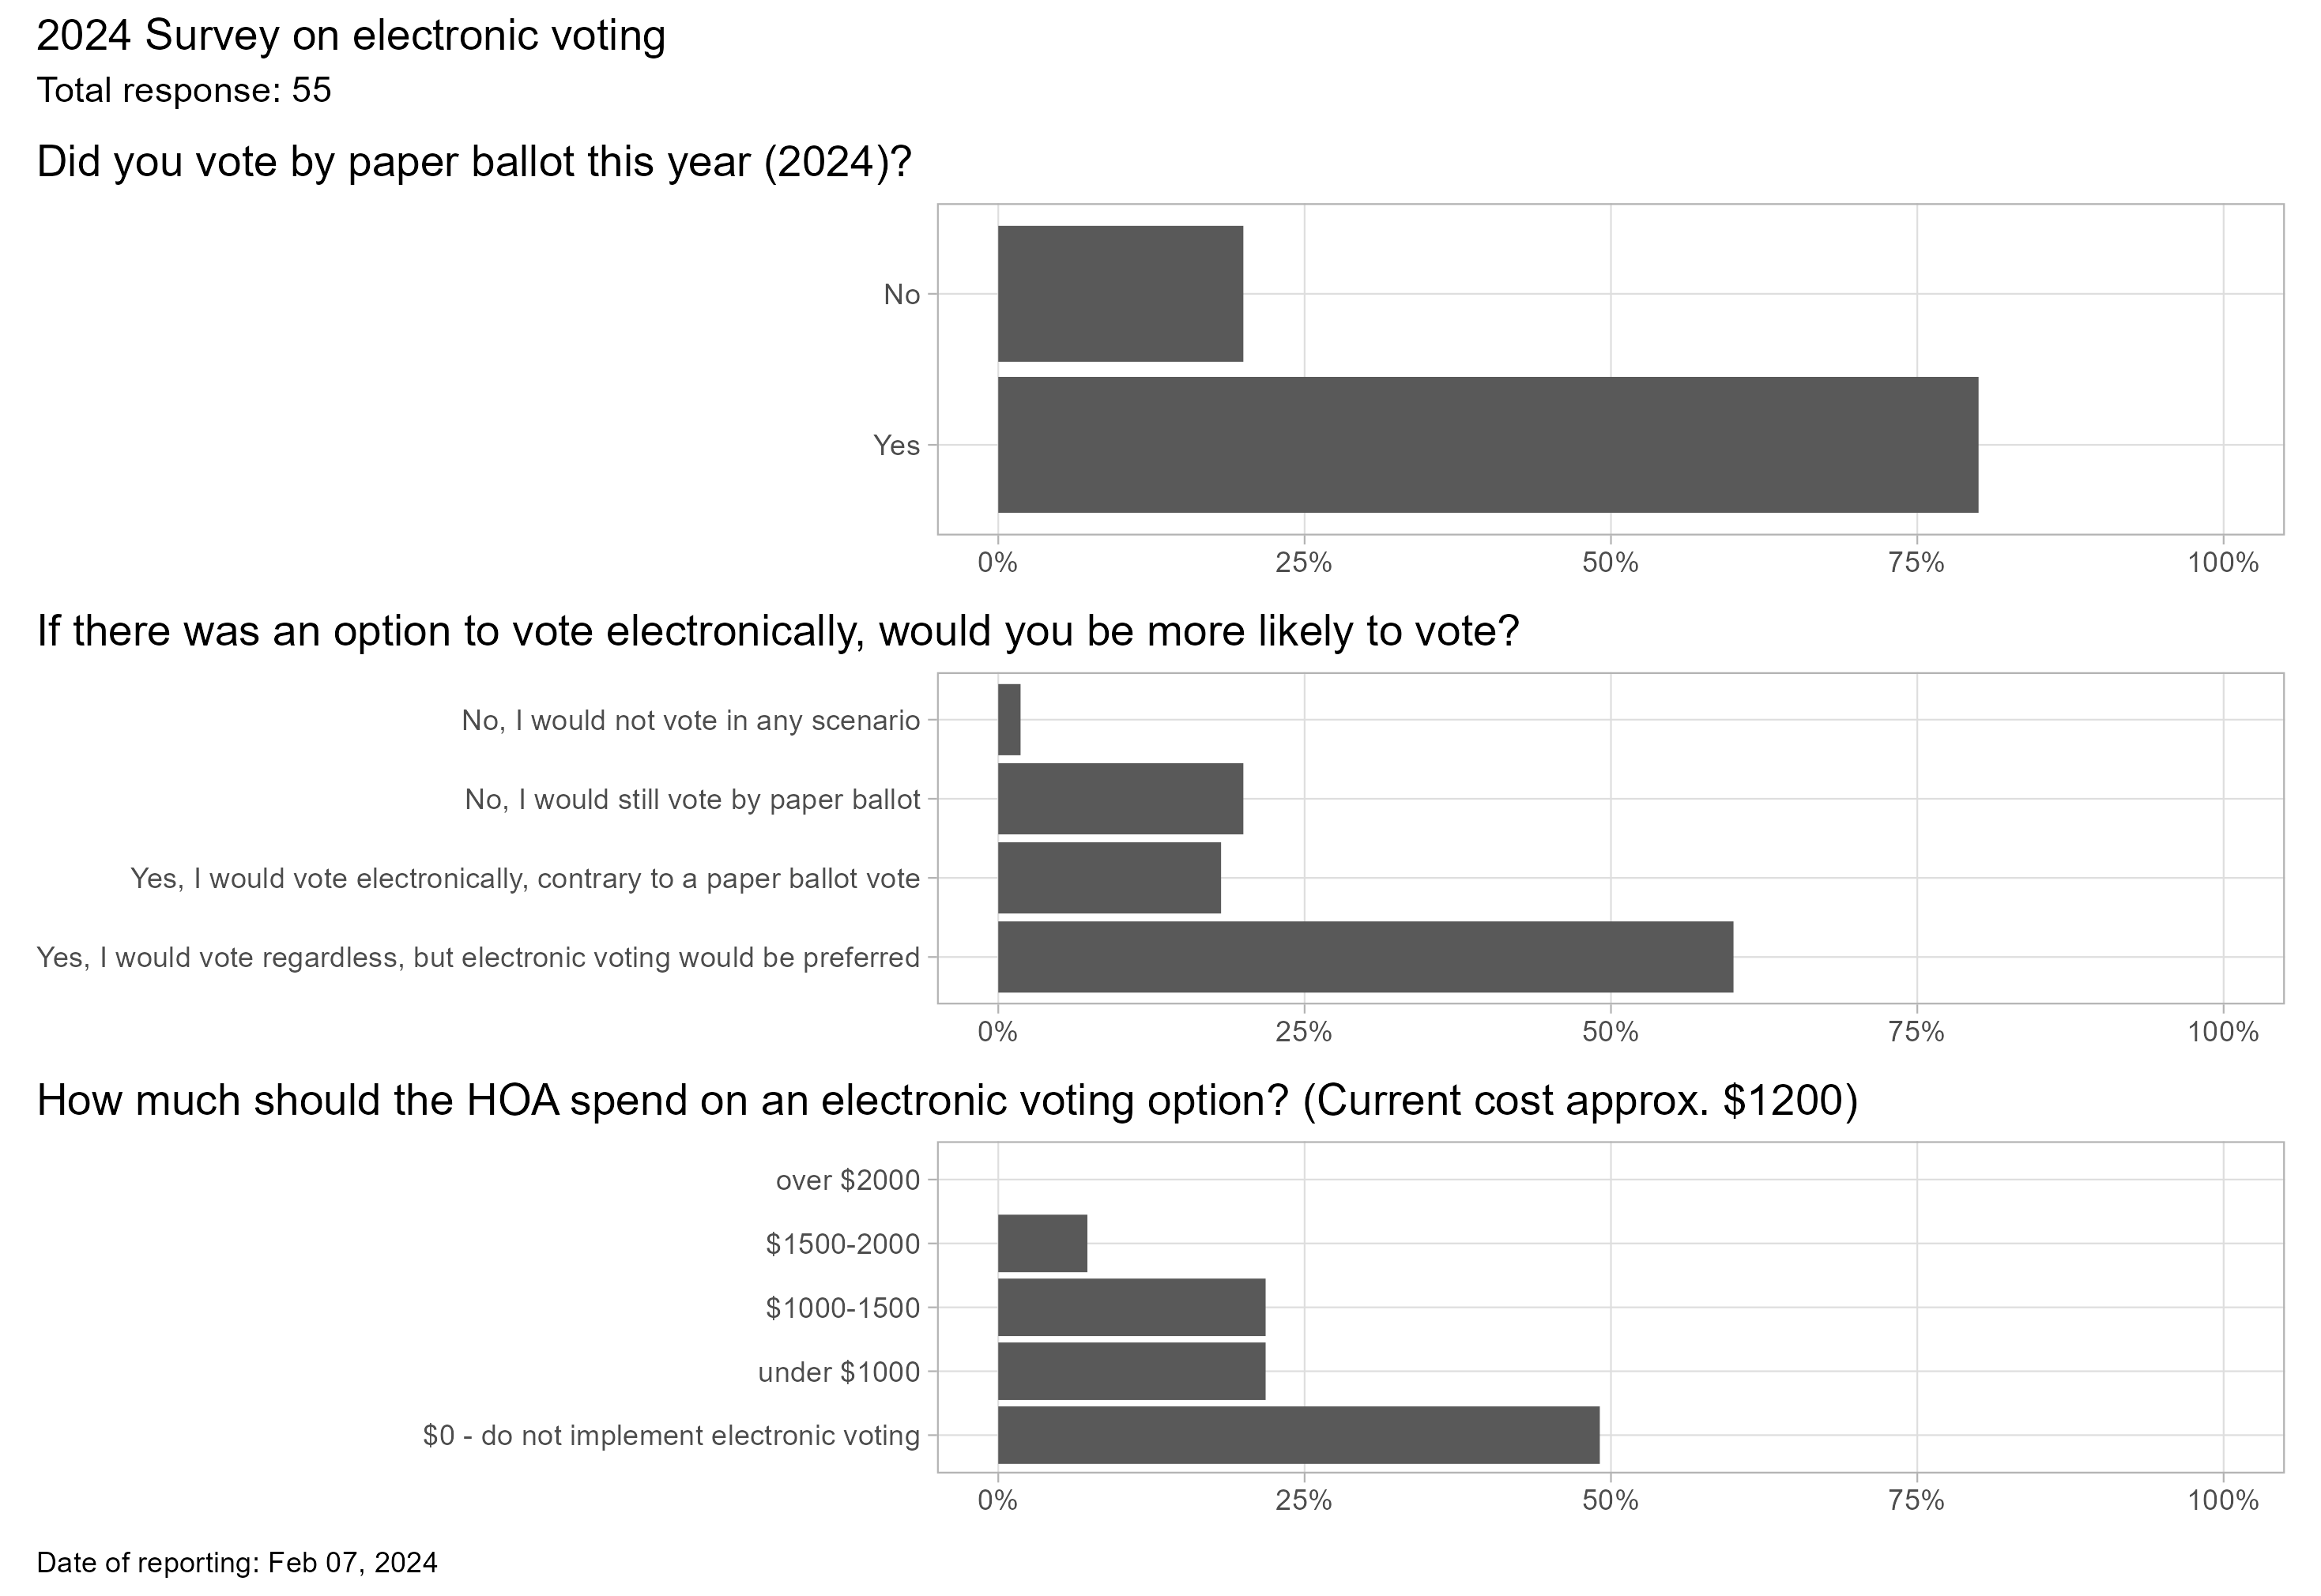
We did a survey on e-voting and the expected cost. I used patchwork to plot the resulting column plot, but the width of the columns changes from plot to plot due to different number of answers.

Is there a way to make the columns the same width within the figure, without distorting the titles/questions?

Example: Question 1 has two options, while questions 2 and 3 have 4 and 5 options. I would like the bars to have the same width regardless of # of options.

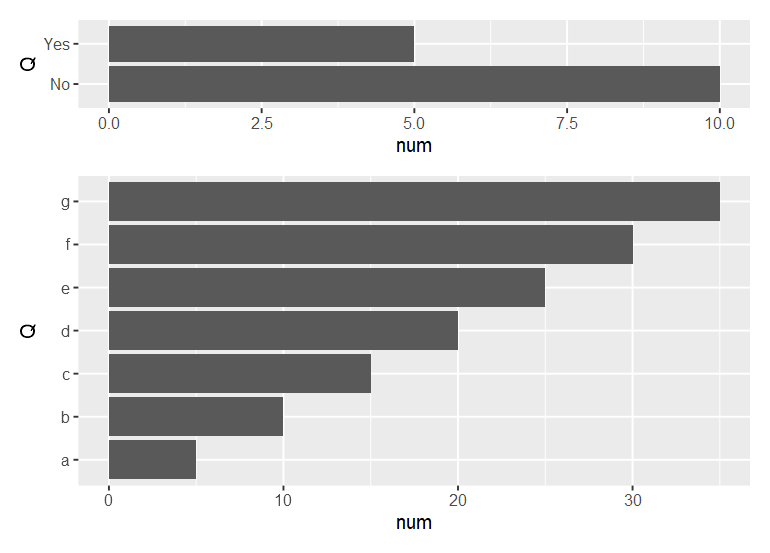
I think this method at least comes close. Pick a baseline column width (I picked 0.8 where 1 has adjacent columns touching), divide that by the maximum number of categories in any of your plots and multiply by the number of categories in the given plot.

library(ggplot2)
DF <- data.frame(A = c("Yes", "No"), B = c(80,20))
DF2 <- data.frame(A = c("Yes", "No","maybe","perhaps"), B = c(10,20,30,40))
DF3 <- data.frame(A = c("Yes", "No","maybe","perhaps","heck no"), B = c(10,20,30,40, 33))
ggplot(DF, aes(A, B)) + geom_col(width = 0.8/5*2) #DF has 2 categories

ggplot(DF2, aes(A, B)) + geom_col(width = 0.8/5*4) #DF2 has 4 categories

ggplot(DF3, aes(A, B)) + geom_col(width = 0.8/5*5) #DF3 has 5 categories

Created on 2024-02-07 with reprex v2.0.2

1 Like

That solves the issue of making the columns equal width, but now there is a lot a space between the "Yes" and "No" of the top chart, and increasingly smaller sizes when there are more options. Is there a way to adjust the height of of the panel, based on the number of options?

Hi Rob,

Are you trying to make a report with RMarkdown (or Quarto), or are you trying to embed image files in a document some other way?

I'm trying to make an image to export.

This seems to work as I would expect

library(tidyverse)

d1 <- data.frame(Q = c("Yes","No"),
                 num = c(5,10))

d2 <- data.frame(Q = letters[1:7],
                 num = 1:7 * 5)
g1 <- ggplot(d1) + aes(x=Q,
                       y=num) + geom_col() + coord_flip()

g2 <- ggplot(d2) + aes(x=Q,
                       y=num) + geom_col() + coord_flip()


library(patchwork)

g1 + g2 + plot_layout(ncol = 1,heights = c(length(d1$Q),
                                           length(d2$Q)))


That works, and it doesn't even distort the title text.

Thanks.

This topic was automatically closed 21 days after the last reply. New replies are no longer allowed.

If you have a query related to it or one of the replies, start a new topic and refer back with a link.