How can i give the colours to the histogram based on high and low values?
my existing code looks like this:
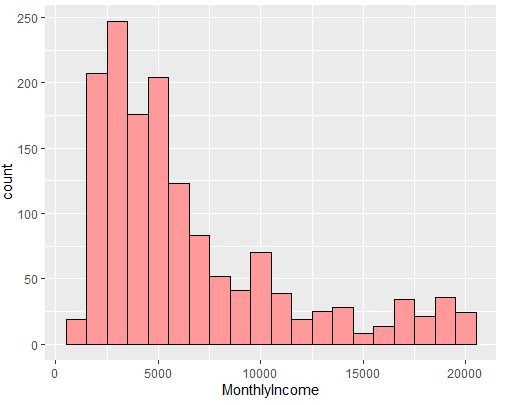
monthy_income <- ggplot(dataset) + geom_histogram(aes(MonthlyIncome), binwidth = 1000, fill = "#FF9999",col = "black")
I want to assign different colors to the below plot based on values and I want to represent the count in legend
FJCC
2
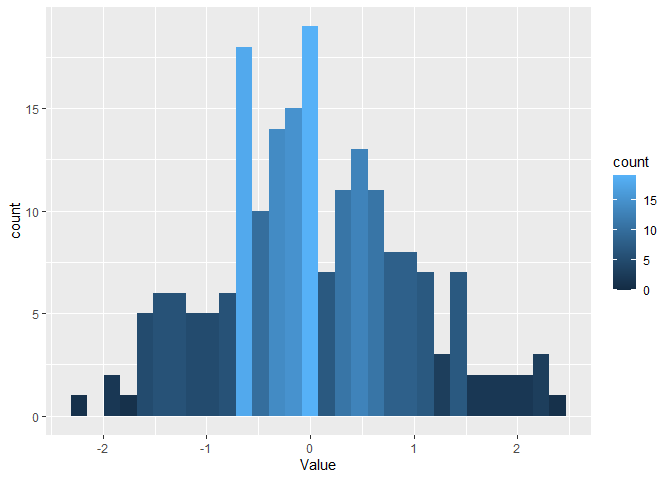
I am not sure I understand what you want. Is it something like this?
set.seed(1)
DF <- data.frame(Value = rnorm(200))
library(ggplot2)
ggplot(DF, aes(Value, fill = ..count..)) + geom_histogram()
#> `stat_bin()` using `bins = 30`. Pick better value with `binwidth`.
Created on 2020-10-27 by the reprex package (v0.3.0)
Ya You understood correctly. I want to like the above plot. Thanks a lot for the solution
system
Closed
4
This topic was automatically closed 7 days after the last reply. New replies are no longer allowed.
If you have a query related to it or one of the replies, start a new topic and refer back with a link.