Hello,
I have a dataset and I want to compute logistic regression but my curve is outside the data. My code is this
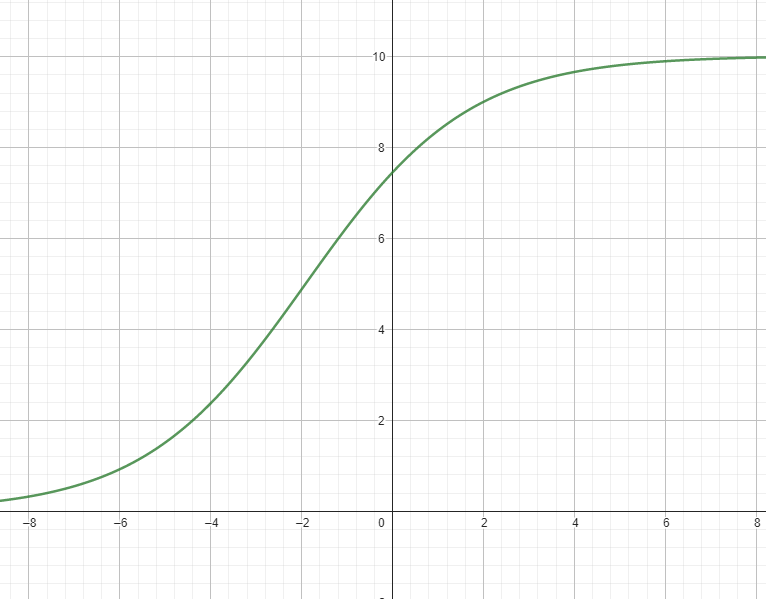
logistic_fun <- function(Obs.max, L, k, x0) {
L / (1 + exp(-k * (Obs.max - x0)))
}
fit <- nls(Note.jour ~ logistic_fun(Obs.max, L, k, x0), data = JOURSmv2, start = list(L = 10, k = 1, x0 = 1))
summary(fit)
coefs <- coef(fit)
JOURSmv2$predicted <- logistic_fun(JOURSmv3$Obs.max, coefs["L"], coefs["k"], coefs["x0"])
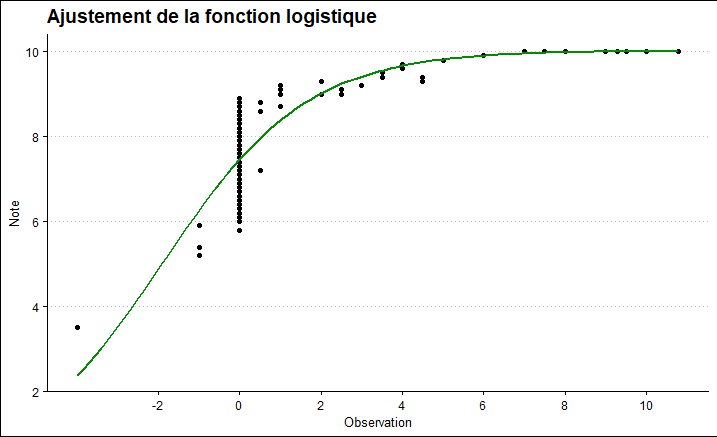
ggplot(JOURSmv2, aes(x = Obs.max, y = Note.jour)) +
geom_point() +
geom_line(aes(x = Obs.max, y = predicted), color = "red") +
ggtitle("Ajustement de la fonction logistique") +
xlab("Observation") +
ylab("Note")
And the result is this
Formula: Note.jour ~ logistic_fun(Obs.max, L, k, x0)
Parameters:
Estimate Std. Error t value Pr(>|t|)
L 10.01757 0.11349 88.270 < 2e-16 ***
k 0.55901 0.06675 8.374 1.23e-15 ***
x0 -1.90839 0.21019 -9.079 < 2e-16 ***
Signif. codes: 0 ‘’ 0.001 ‘’ 0.01 ‘’ 0.05 ‘.’ 0.1 ‘ ’ 1
Residual standard error: 0.6446 on 362 degrees of freedom
Number of iterations to convergence: 9
Achieved convergence tolerance: 5.988e-06
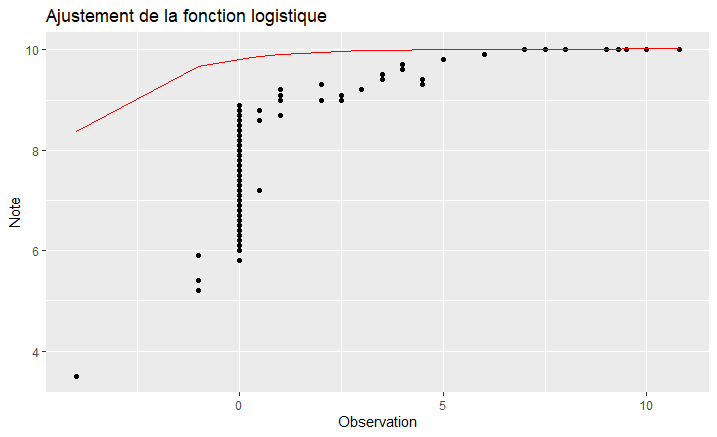
It's not good. How to fix that ?